CIMEL in the French delegation of the French President on his mission in China.
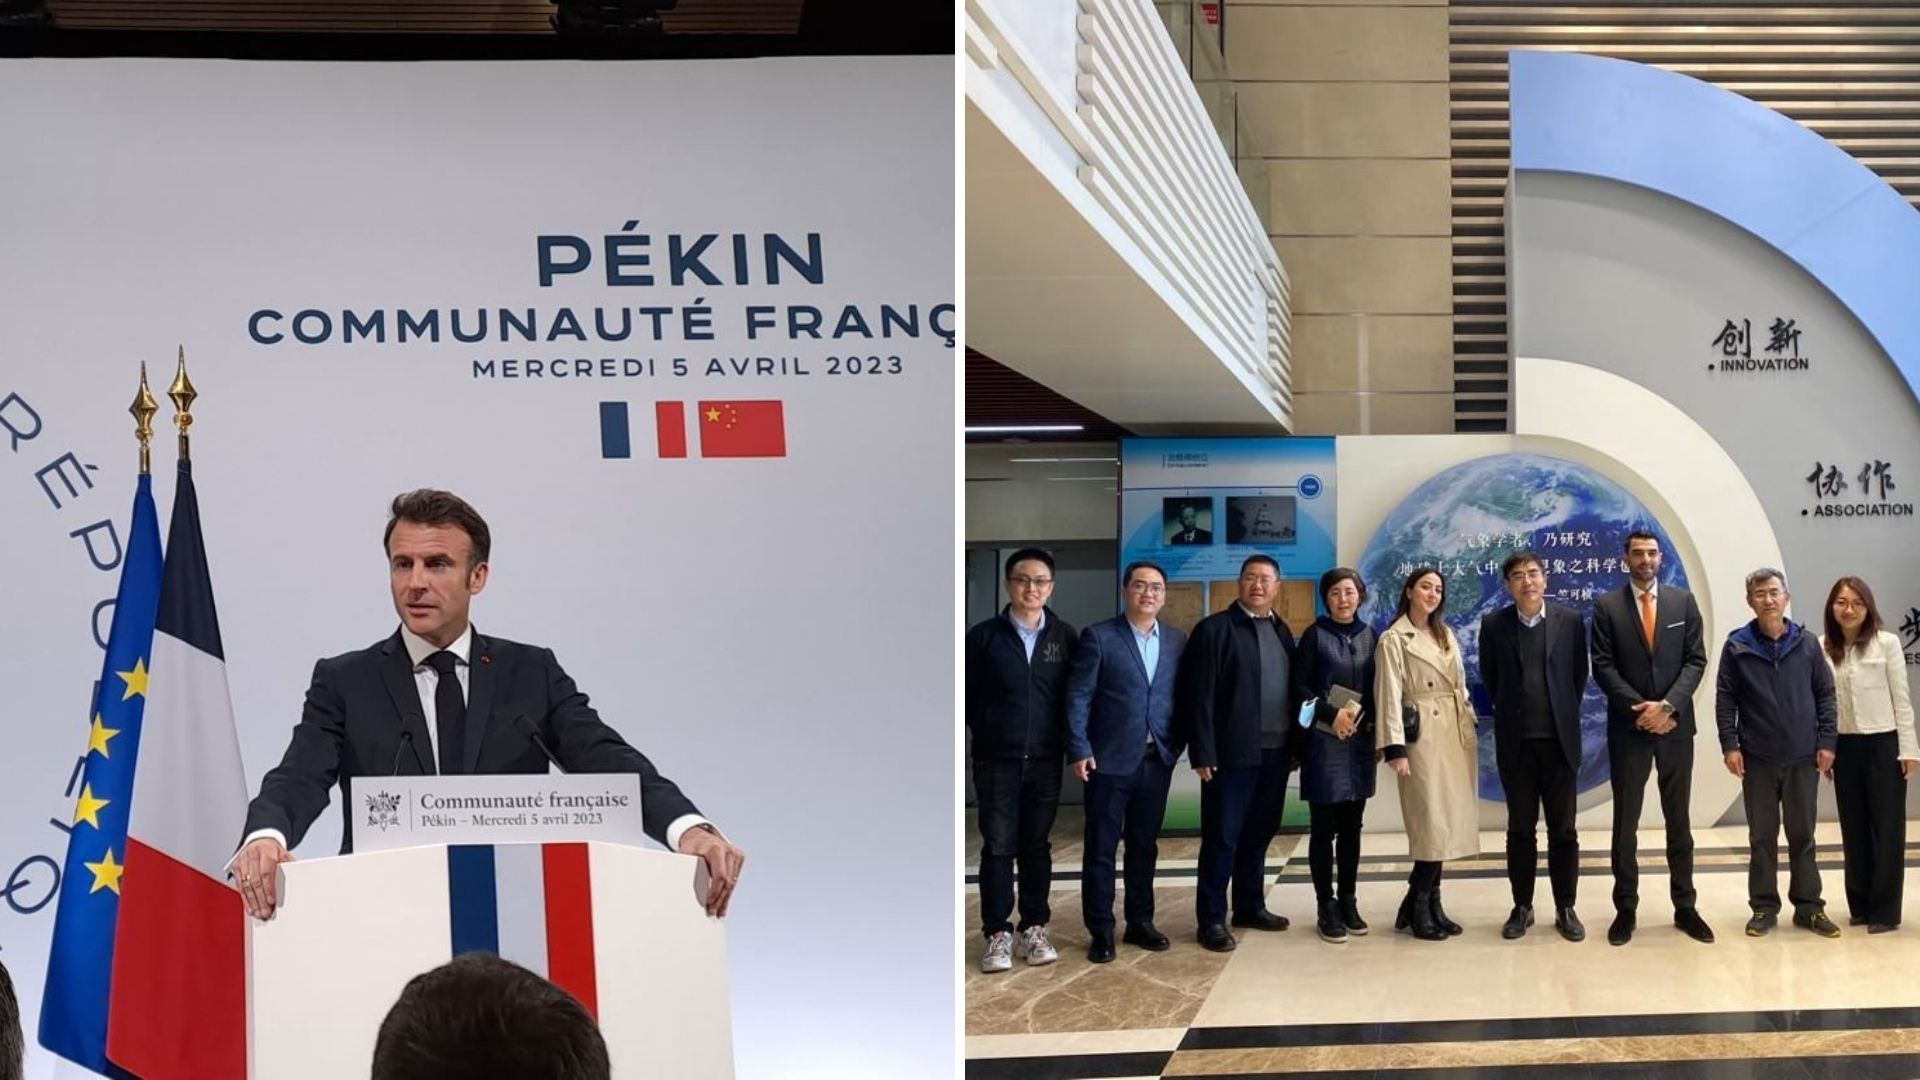
CIMEL is proud to have accompanied the French President Emmanuel Macron on his mission in China, organized in collaboration with Business France and the French Embassy from April 3rd to 7th 2023.
This was an important geopolitical event, as we were part of the first French delegation to come back in China after the reopening of the borders and the lifting of sanitary restrictions linked to COVID-19.
It was also an opportunity for companies such as ours (with special regards to Chromatotec, ENVEA Group, Greentech Innovation) to shine through lobbying and gathering decision makers on climate change and environmental issues.
Our Sales and Marketing Director, Idris SANHAJ and our International Business Developer Laura MARIT have represented CIMEL through business meetings with our Chinese partners (CMA Chinese Meteorological Agency, CAS Chinese Academy of Sciences, Environmental Monitoring Centers of Shanghai Municipality and Jiangsu Province, Guangzhou University…) and to exchange ideas with various members of the French delegation organized by Business France.
They had the opportunity to encounter the French President Emmanuel Macron and had a brief meeting with the Minister of Economy and Finance Bruno Lemaire to discuss the future of air quality application with our innovative solutions, in particular for the JO2024 Olympic Games in Paris.
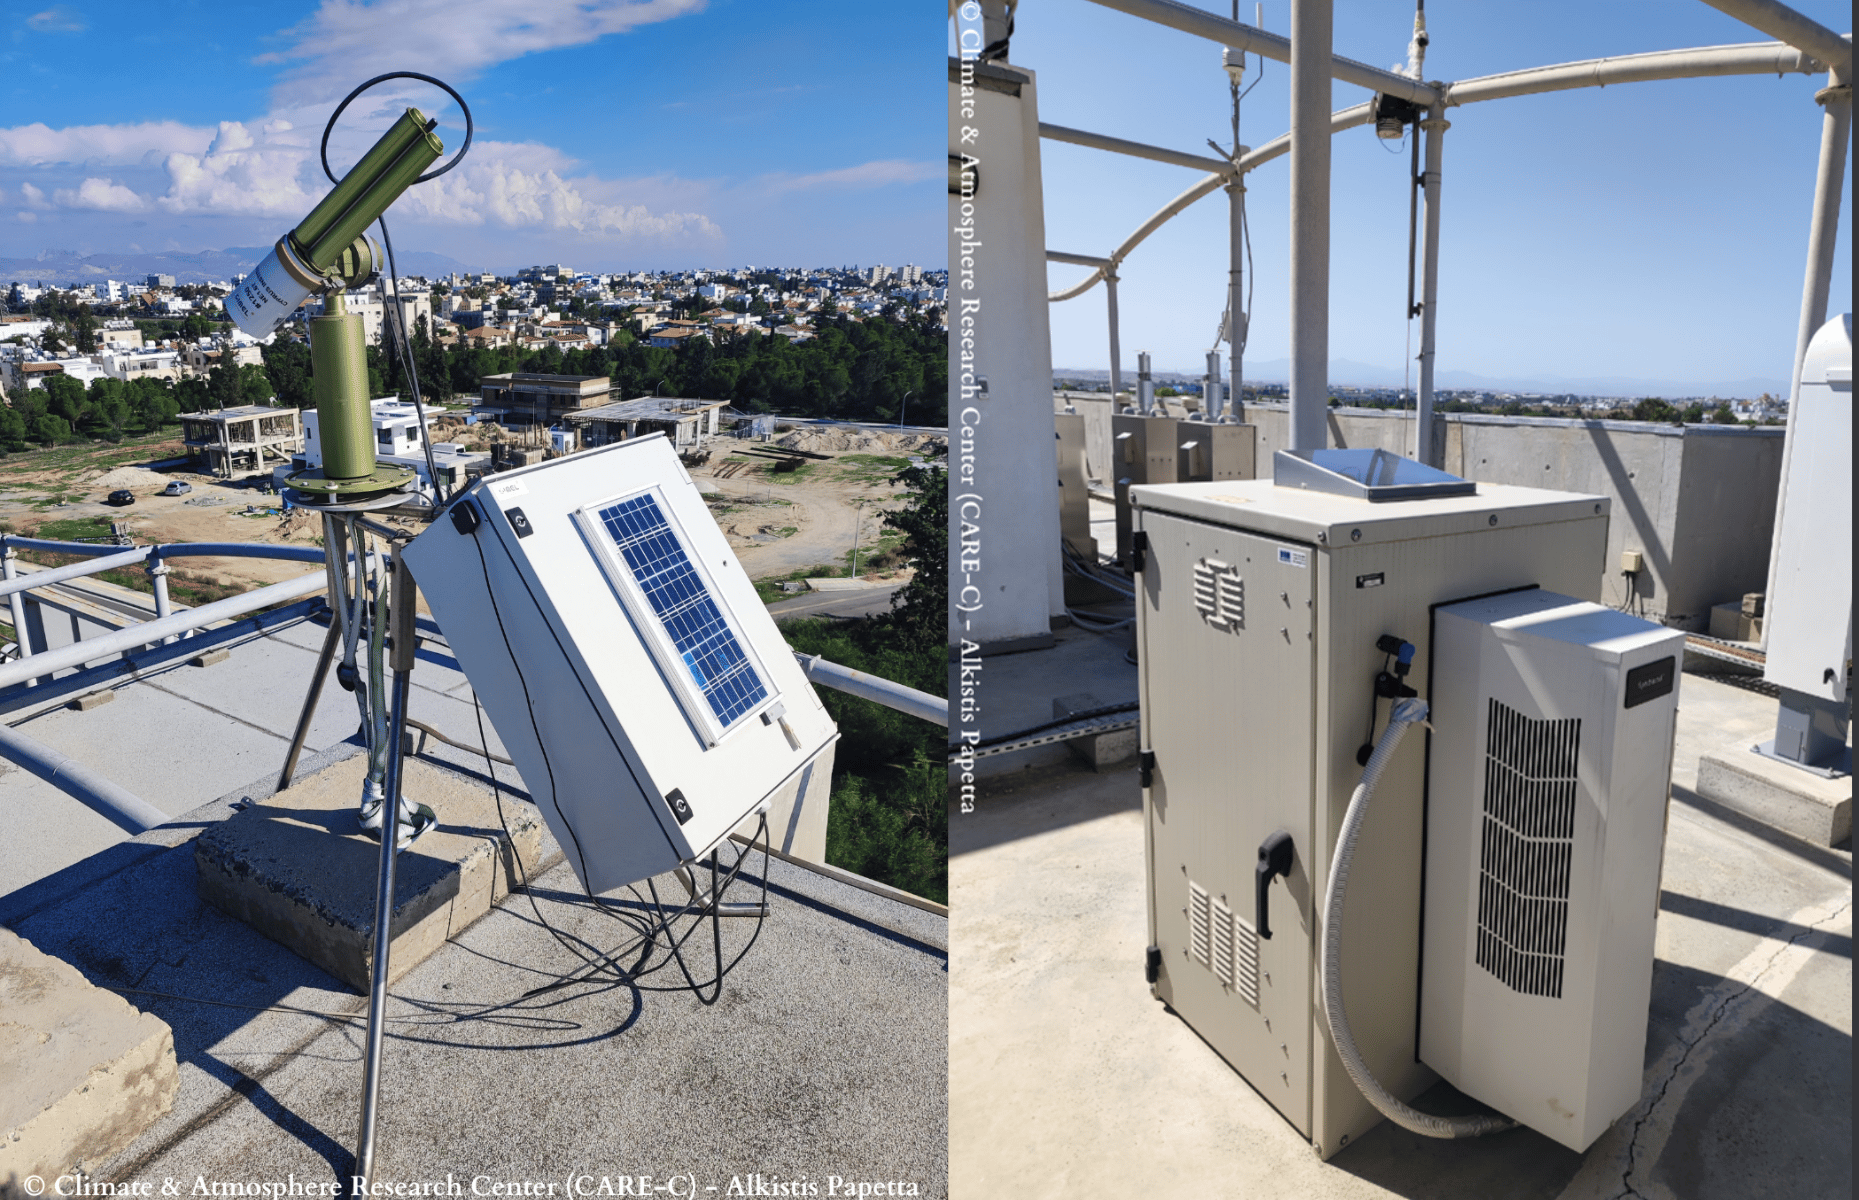
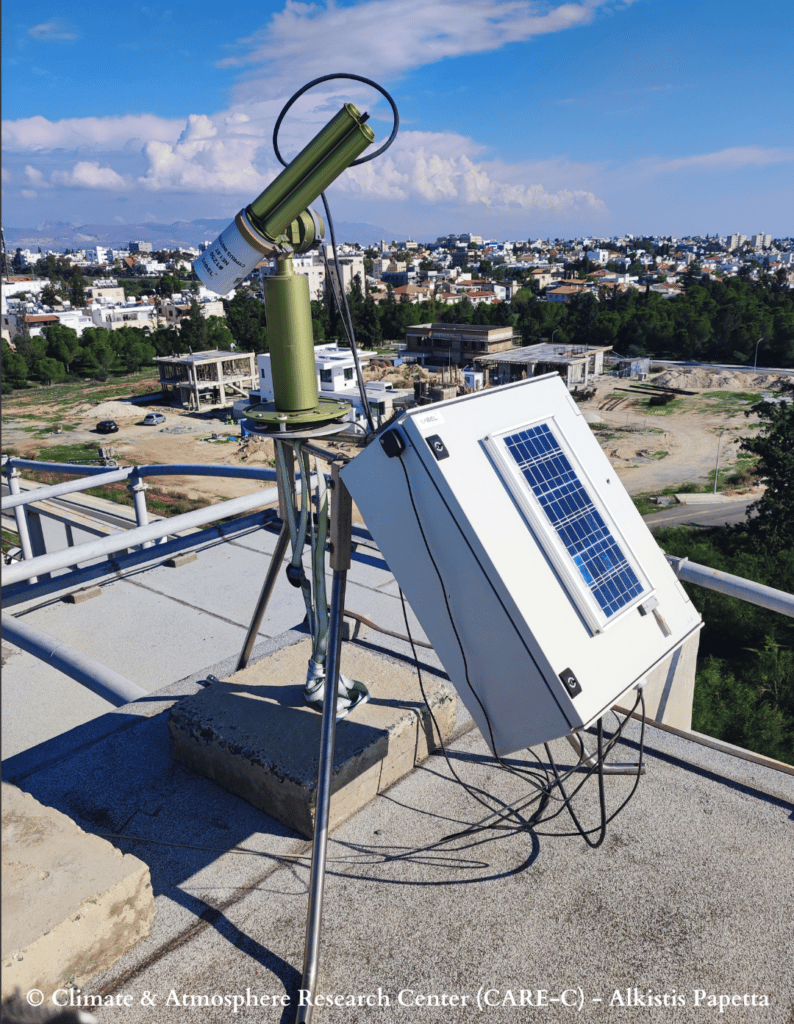
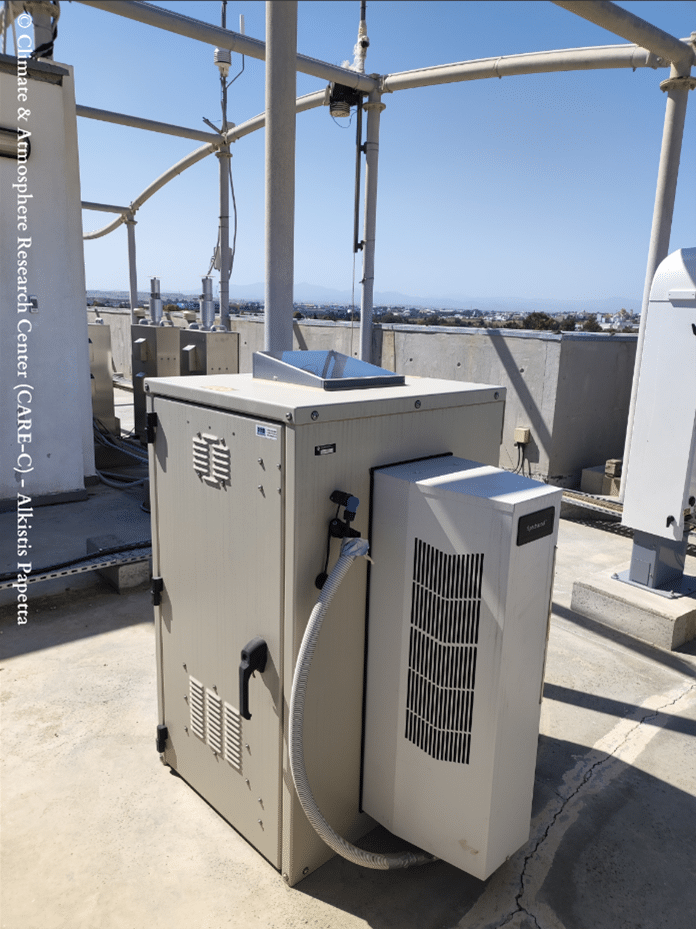
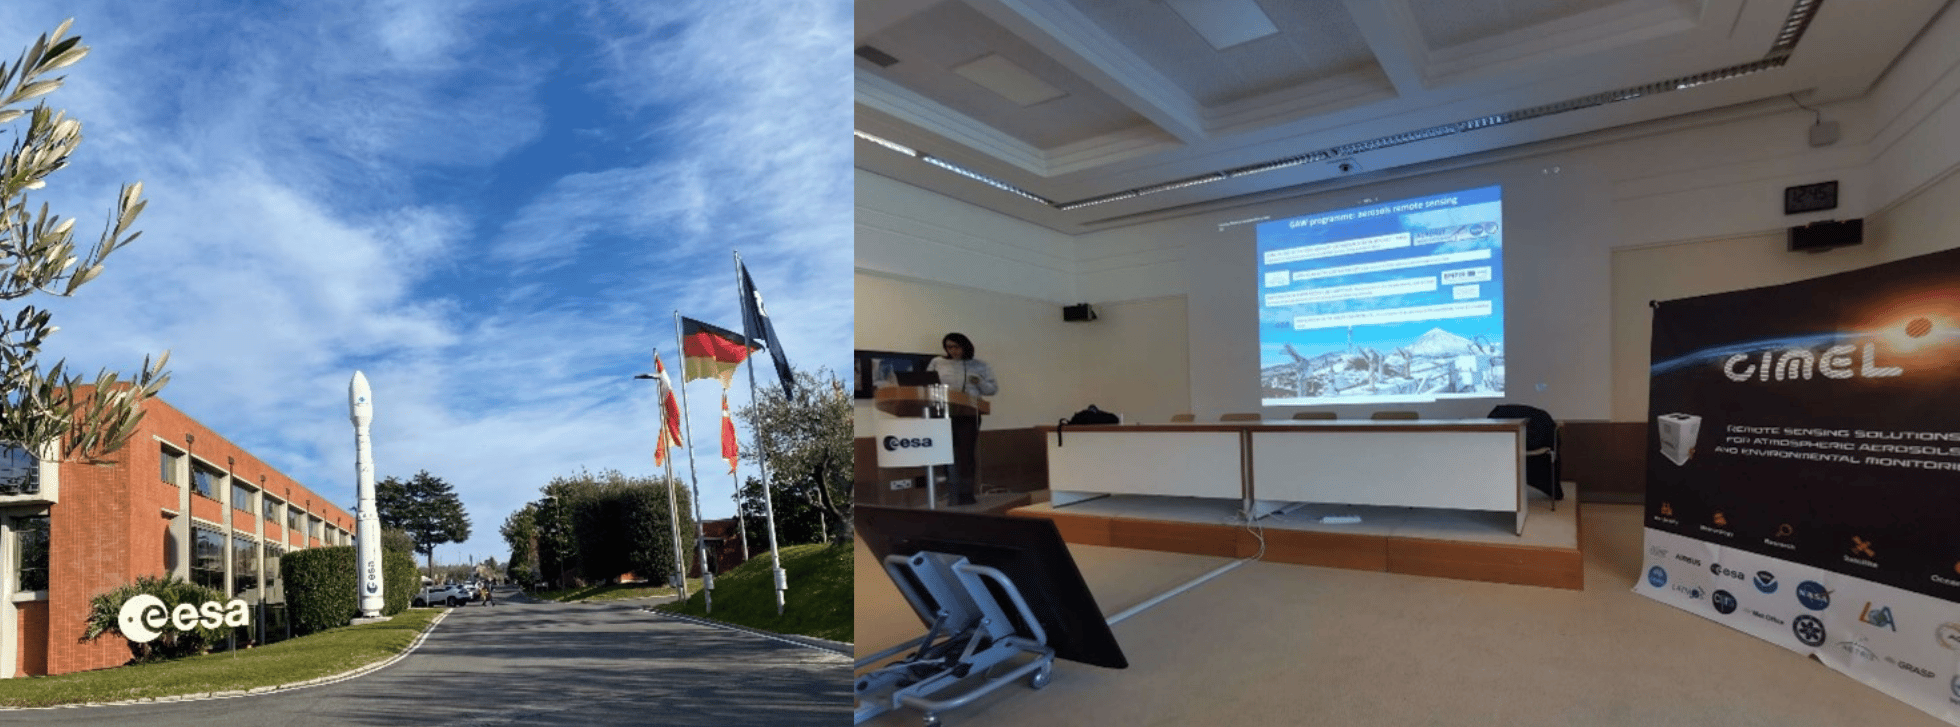
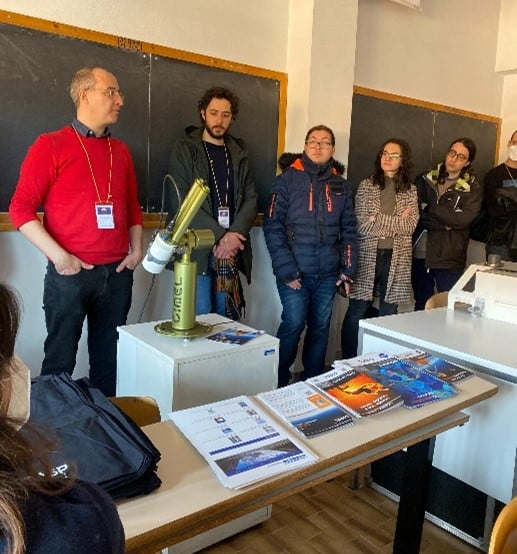
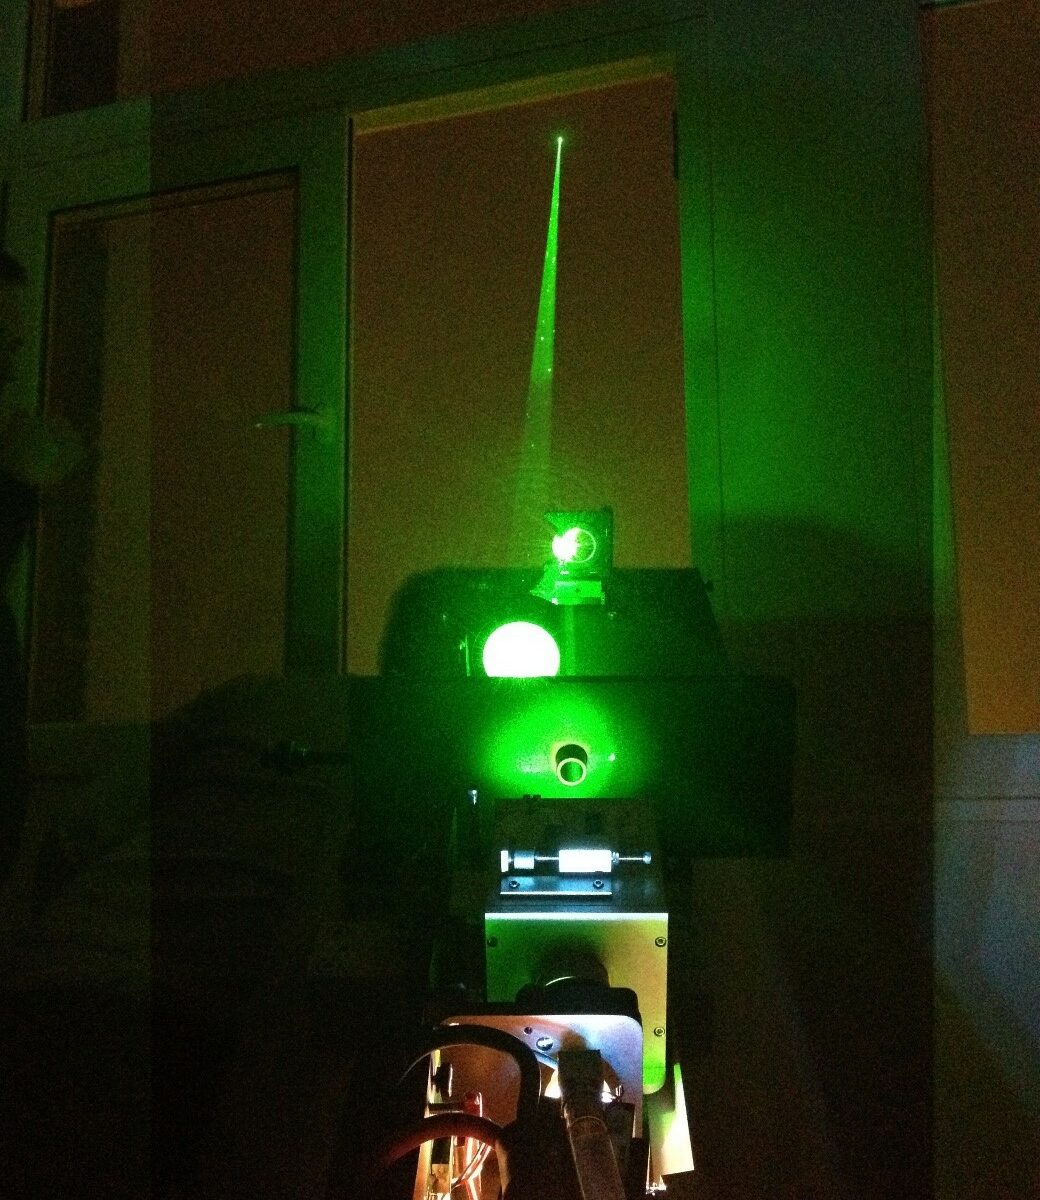
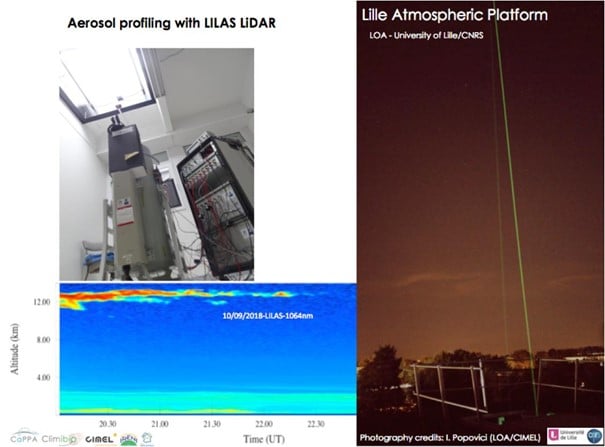
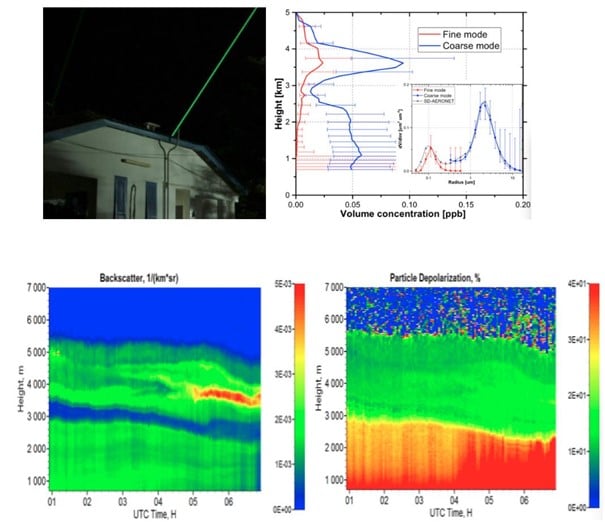
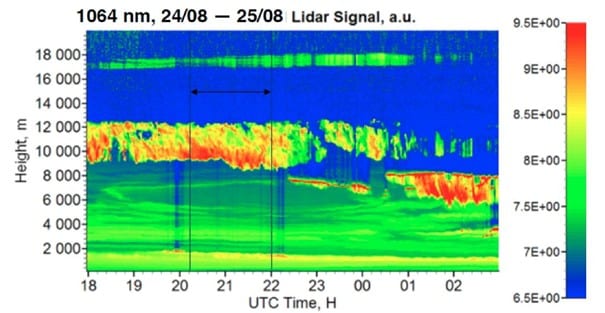
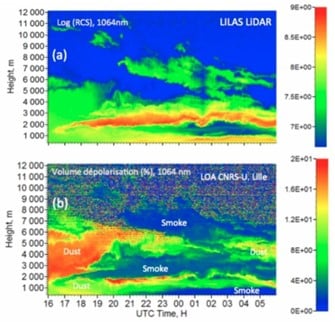
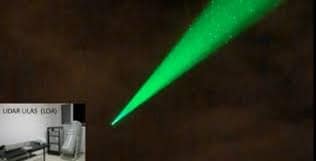
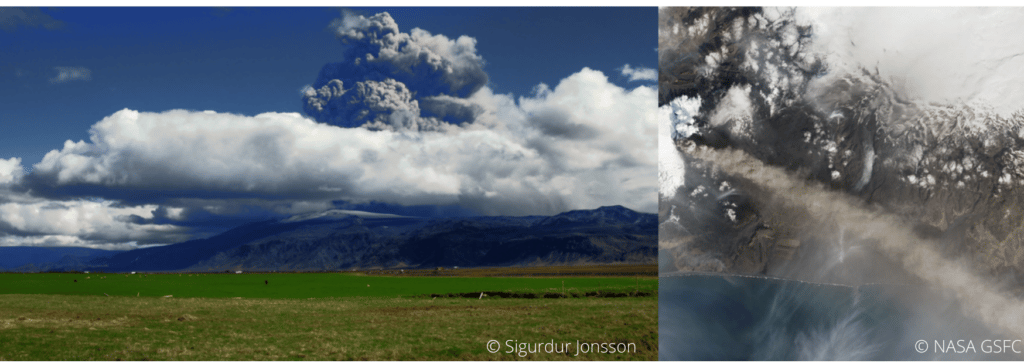
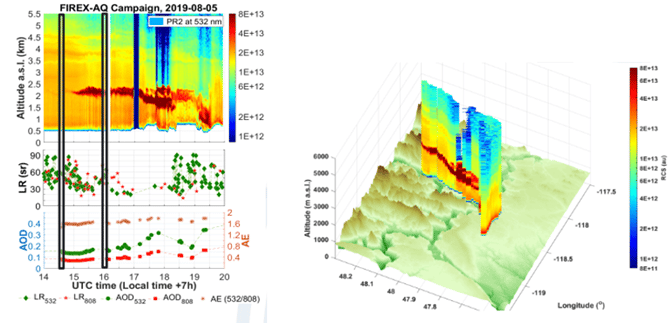
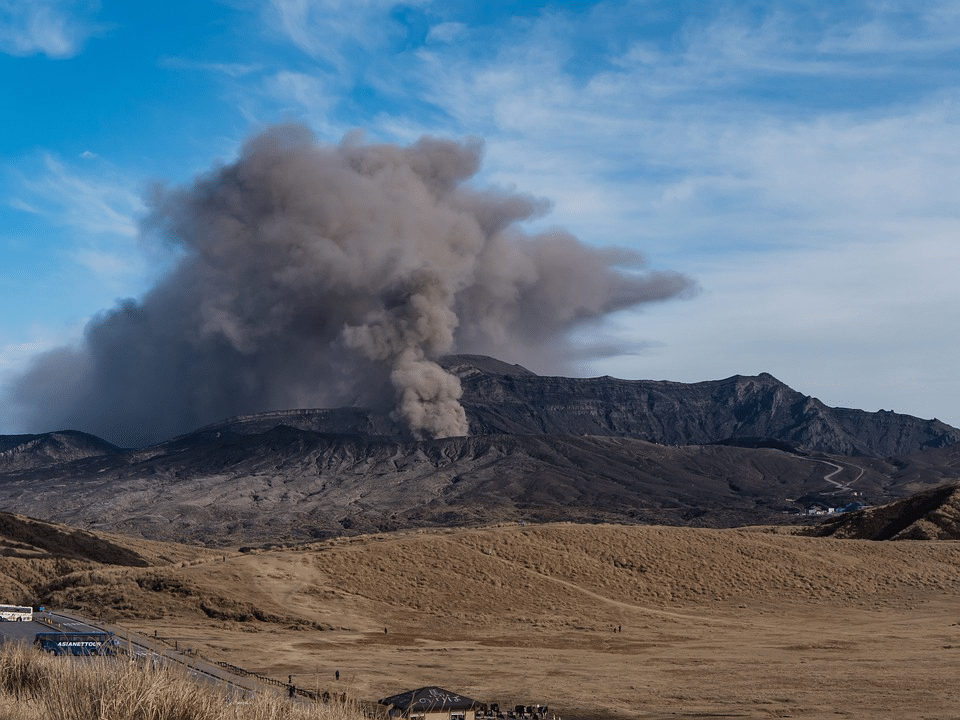
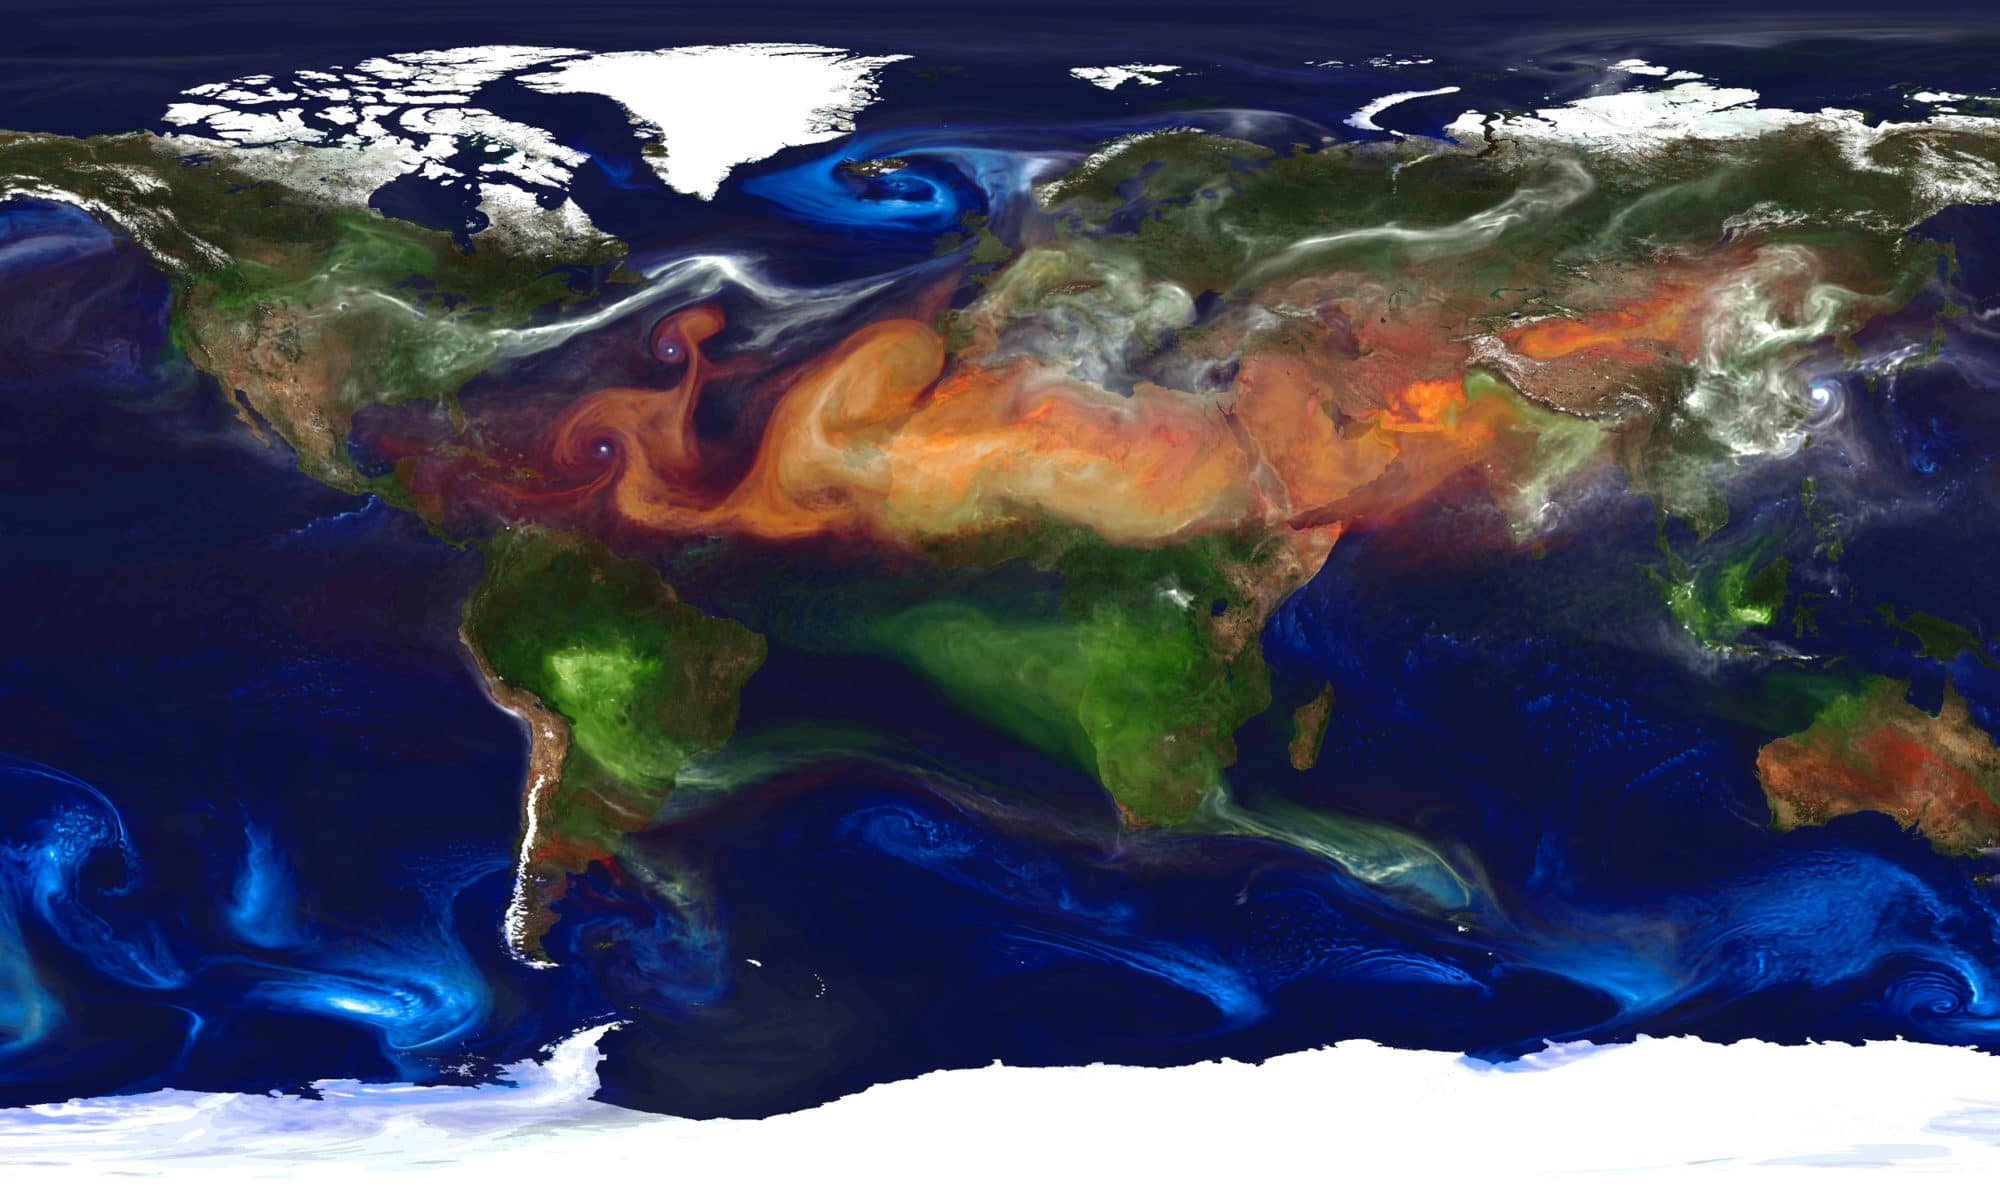
During this mission, CIMEL has presented its remote sensing solutions for aerosols monitoring, used to increase the understanding of atmospheric phenomenas, improve and validate air quality models.
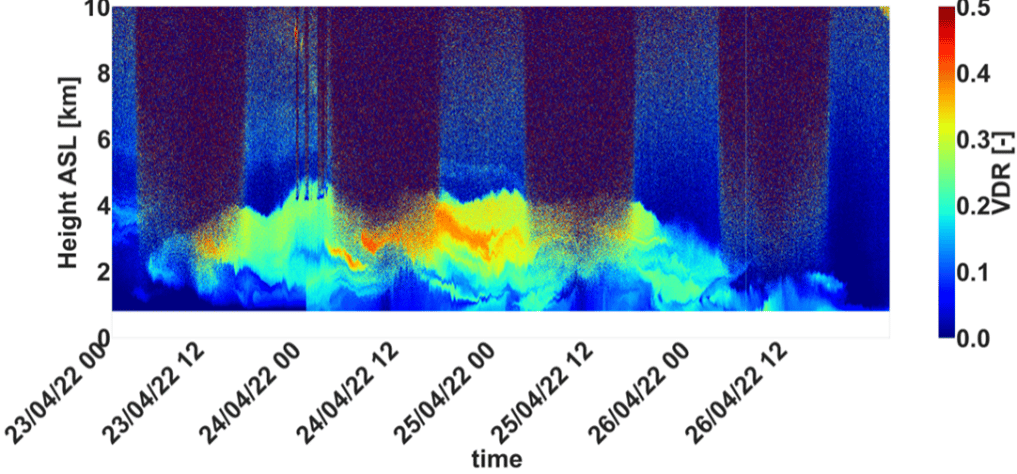
This combination of climate modeling, through in-situ sensors, satellite data, and ground remote sensing, allows for more accurate air quality forecasting and decision-making for public health and environmental management.
We look forward to continuing to serve our customers in China and across the globe with the same level of excellence and dedication that has become synonymous with our brand Made in France.
🙏 We extend our gratitude to Business France (Laurent Saint-Martin, Xavier CHATTE-RUOLS, Baptiste DELBENDE, Nicolas SESTIER), teamfranceexport (Valérie Alvarado-Zongo, Yang Yang, Michelle Portugal, Lian Qu), and CCI FRANCE CHINE (Caroline Penard, Christophe Lauras) for coordinating this successful business trip.