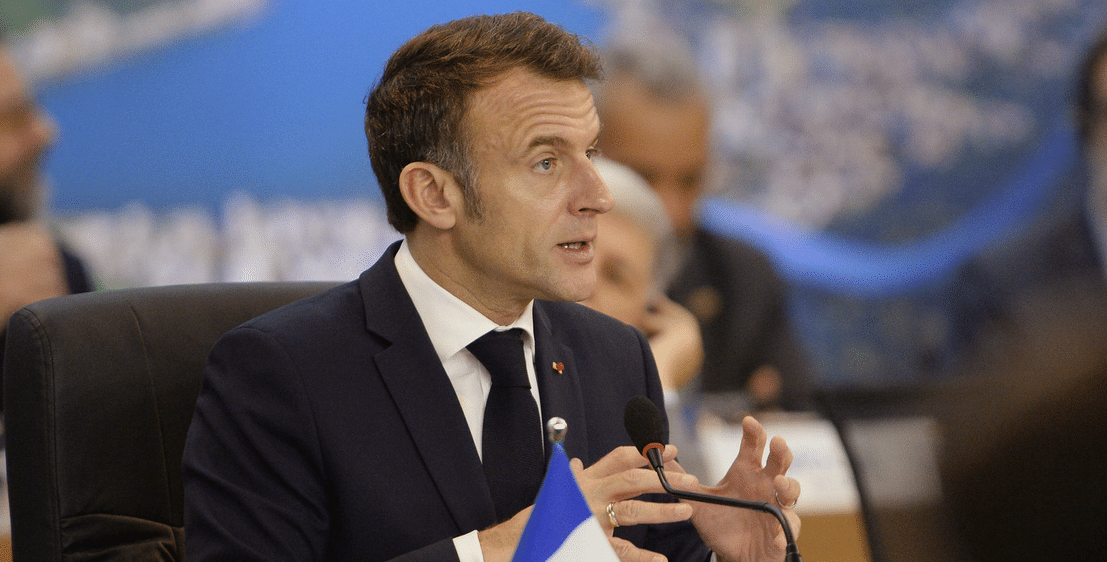
As part of the official visit of French President Emmanuel Macron to Southeast Asia in May 2025, a delegation of French companies and institutions took part in a strategic mission in Vietnam and Indonesia under the “France-Vietnam: A Shared Future” initiative.
CIMEL, represented by Idris SANHAJ, our Sales and Marketing Director, was honored to be part of the French delegation, reaffirming our commitment to international scientific and environmental cooperation.
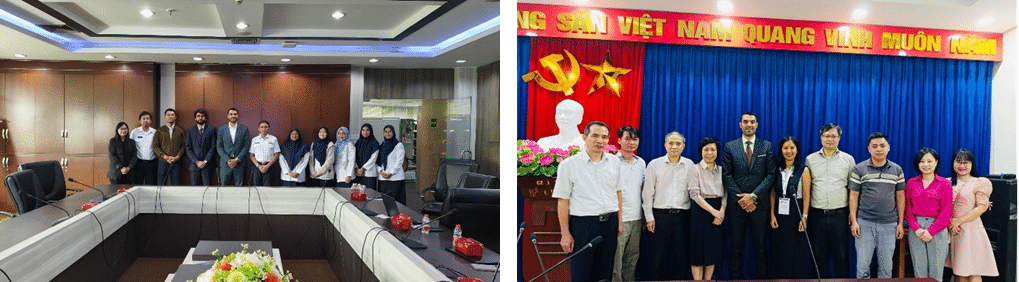
During this mission, CIMEL had the opportunity to engage with several national authorities and scientific institutions:
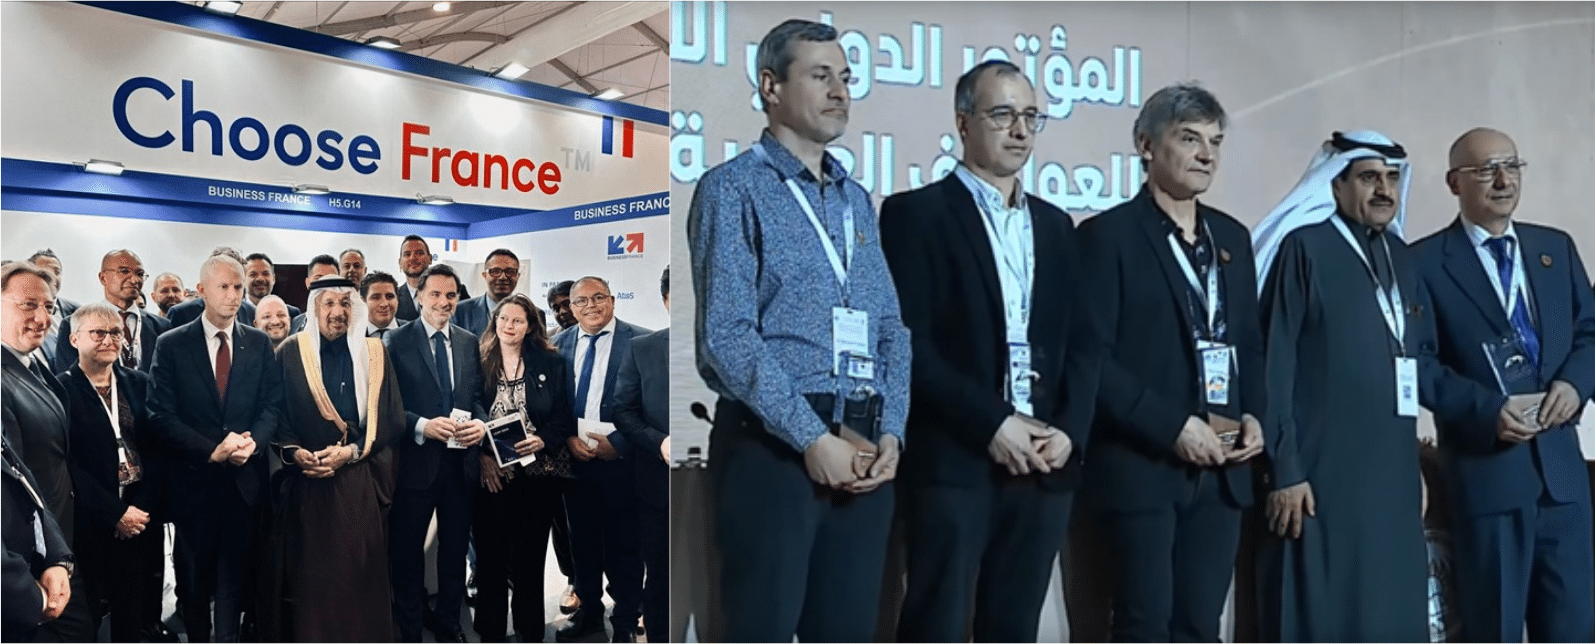
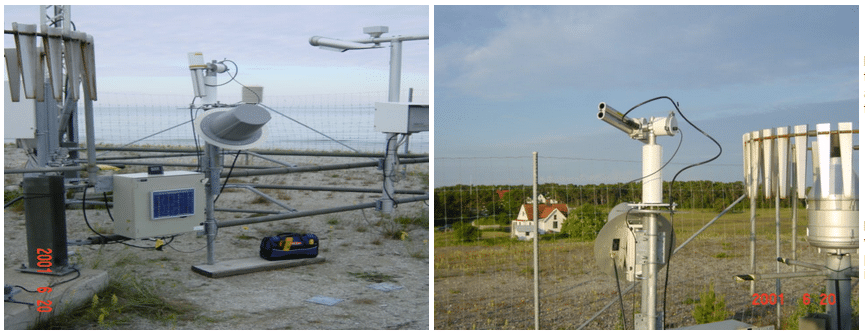
In Indonesia, Idris visited the BMKG (Badan Meteorologi, Klimatologi, dan Geofisika), the national agency for meteorology, climatology, and geophysics, to explore avenues for collaboration on atmospheric observation and extreme weather monitoring (picture on the left).
In Vietnam, he met with the Vietnam Academy of Science and Technology (VAST) and several research teams to discuss cooperation in aerosol monitoring, dust events, and solar radiation measurements (picture on the right).
This mission, supported by Team France Export and the French Embassy, highlighted CIMEL’s role as a key player in atmospheric observation technologies in the Asia-Pacific region — particularly in the context of the Just Energy Transition Partnership (JETP) and climate change adaptation strategies.
We are deeply grateful to all our partners for their warm welcome and shared ambition to tackle pressing environmental challenges through science and innovation.
CIMEL is proud to contribute to global initiatives for a cleaner, more resilient, and sustainable future.
The Laboratoire d’Optique Atmosphérique (LOA) at the University of Lille, in collaboration with CIMEL, focuses on studying clouds, aerosols, gases, and their interactions with radiation, utilizing advanced remote sensing instrumentation for experiments, observations, and modeling. LOA brings its expertise to ACTRIS as the Quality Assurance and Control Lead, playing a crucial role in maintaining precise and reliable photometric aerosol measurements.
Since 1991, LOA and CIMEL have collaborated to advance and refine photometry techniques for measuring aerosols and water vapor. This collaboration was at the origin of the NASA AERONET planetary network, built with the CIMEL sun/sky/lunar photometers for over three decades. In 2005, building on this success, they extended their cooperation to include aerosol LiDAR technologies. Finally, in 2020, LOA and CIMEL established a joint research laboratory, AGORA-Lab, to develop advanced remote sensing technologies, including Lidars and photometers, and to combine them for cutting-edge performance.
LiDARs provide high-resolution vertical profiles of aerosols and clouds, while photometers offer column-integrated aerosol optical properties. By combining these measurements, calibration, quality control and retrievals are enhanced, leading to better quantification and characterization of aerosols and higher-level data products.
Since 2012, CIMEL and LOA have collaborated on developing the CE710 LiDAR, a high-power, multi-spectral Mie-Raman-Fluorescence LiDAR, spearheading significant advancements in aerosol measurement capabilities. The first version, called LILAS, was set up on the ATOLL platform (Atmospheric Observatory of Lille) and has been part of ACTRIS since 2015.
LOA and CIMEL continuously advance the industrialization and validation of the CE710 LiDAR range, making it a cost-efficient, modular solution that is ACTRIS-ready, meaning it meets all current and future guidelines. This cutting-edge technology provides innovative features that enhance measurement accuracy, operational efficiency, and adaptability to evolving scientific needs.
CE710 LiDAR range: Key features
Multi-wavelength emission: 355, 532 and 1064 nm.
Up to 15 detection channels: to profile a wide range of atmospheric parameters, including aerosol backscatter, depolarization, fluorescence, water vapor, trace gases, and temperature.
Advanced laser technology: Uses diode or flash-lamp pumped Nd:YAG lasers with energy per pulse up to 200 mJ at 355 nm and repetition rate up to 200 Hz.
Depolarization capability: Measures linear depolarization ratios at multiple wavelengths to distinguish between spherical and non-spherical particles.
Fluorescence detection: Provides additional vertically resolved information to improve aerosol typing.
Customizable configurations: The modular design allows adaptation to initial and evolving research objectives.
Robust and transportable design: Facilitates installation, inside or outside with optional thermal enclosure.
Data Processing: Includes AUSTRAL software for real-time visualization and interpretation of measurement data.
Key benefits of the CE710 LiDARs for the ACTRIS community
Enhanced data quality: The CE710 meets all the requirements of the stringent ACTRIS Quality Assurance guidelines, that ensure high measurement precision and reliability and are a prerequisite for data certification by ACTRIS.
Comprehensive aerosol profiling: The multi-channel design allows detailed characterization of aerosol physical and chemical properties, providing valuable inputs for atmospheric models.
Integrated calibration tools: The built-in remote control and calibration functions enable operators to consistently perform standardized quality control operations over time.
Advanced analysis capabilities: The AUSTRAL software offers real-time data processing and visualization, enabling quick assessment of atmospheric conditions and facilitating advanced research and collaborative projects.
Future-Proof Design: The modular architecture supports future upgrades, allowing the system to adapt to evolving scientific requirements and technological advancements.
For more information on the CE710 LiDAR range, click here!
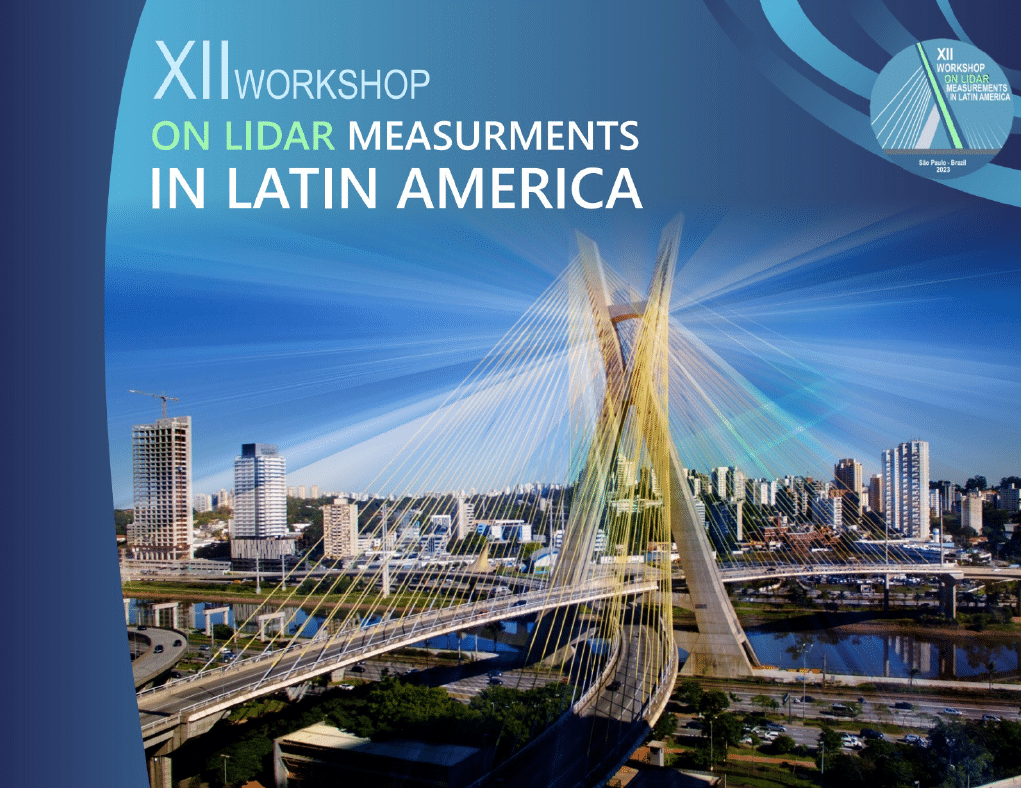
The Latin America Lidar Network (LALINET), was created during the first Workshop on LiDAR Measurement in Latin America (WLMLA) in 2001, to better understand aerosol distribution over South America and its impact on weather and climate.
This year is organized the 12th edition of the Workshop on Lidar Measurements in Latin America (XII WLMLA) hosted by IPEN (Instituto de pesquisas energéticas e nucleares) in São Paulo, Brazil, from 7th to 12th April 2024.
The goal of this event was to share knowledge between LiDAR researchers and students, promoting cooperation between scientific members of the LiDAR community, and fostering future LiDAR research projects to strengthen the Latin-American Lidar Network (LALINET).
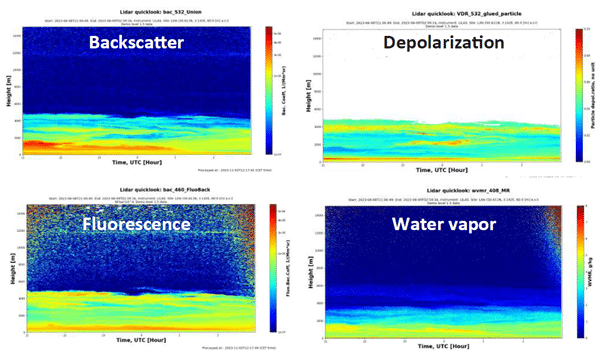
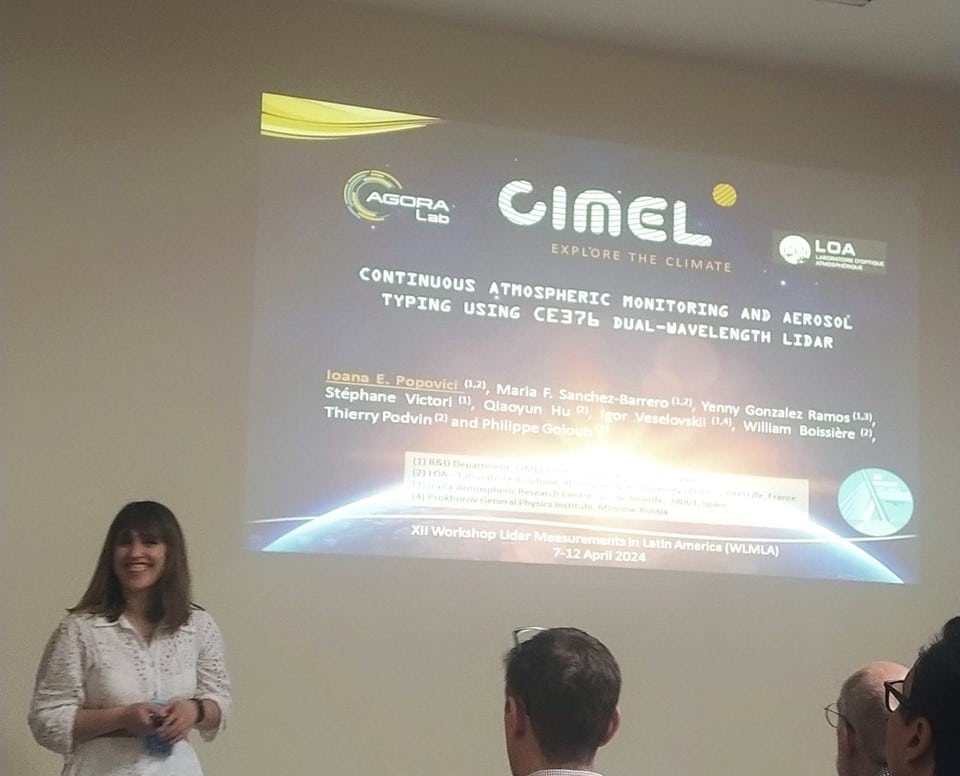
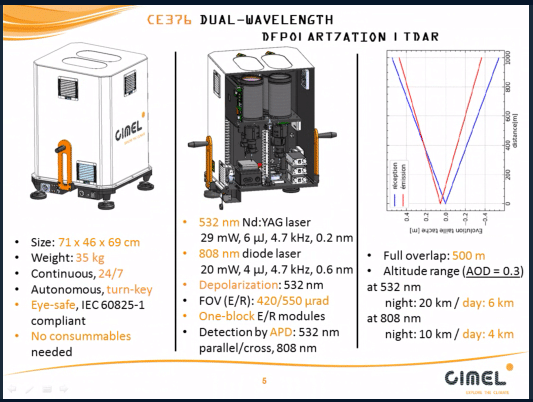
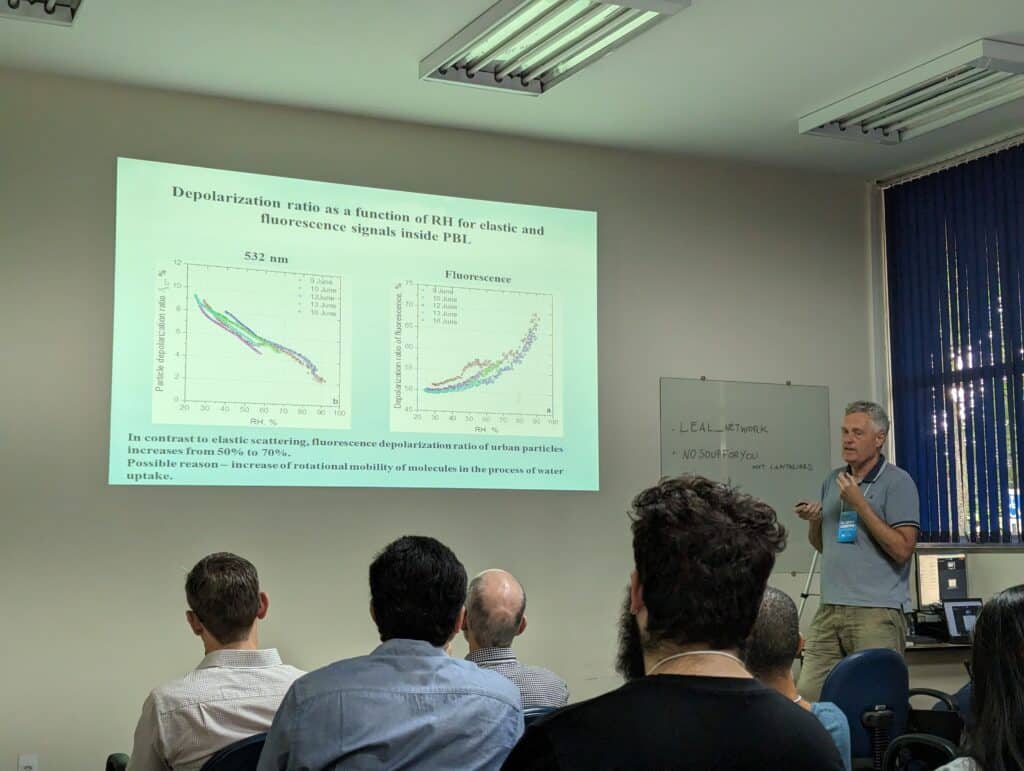
Two representatives from CIMEL, Dr.Ioana Popoviciand Dr. Igor Veselovskii, had the opportunity to present our LiDAR technology and share some data collected on smoke and dust events using our CE376 LiDAR and the CE710 LILAS depolarization and fluorescence channels.
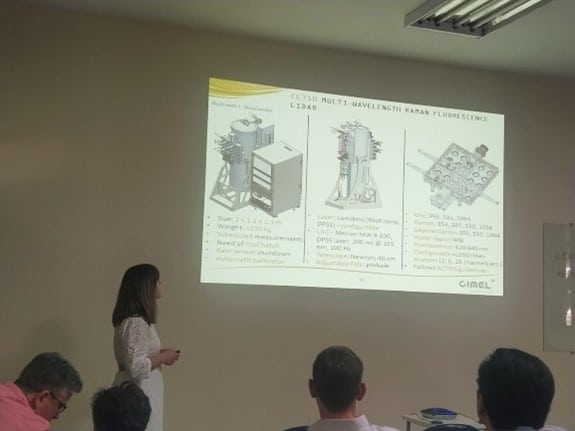
It was also the opportunity to introduce our new LiDAR CE710 developed within AGORA-Lab.
Special thanks to LALINET and IPEN for the organization of this conference.
French President Emmanuel Macron Leads CIMEL and Various French Companies in Brazil for Economic Diplomacy and Green Transition Innovation
Keywords: Aerosols, monitoring, remote sensing, green transition, innovation.
March 25-28th 2024
Once again CIMEL had the honor to be part of the French delegation accompanying the French president Emmanuel MACRON this time in Brazil in São Paulo from 25th to 28th March 2024.
Organized by MEDEF International and Business France, this delegation of over 80 French companies was embarking on a journey to Brazil, aimed at fostering stronger economic ties between the two countries.
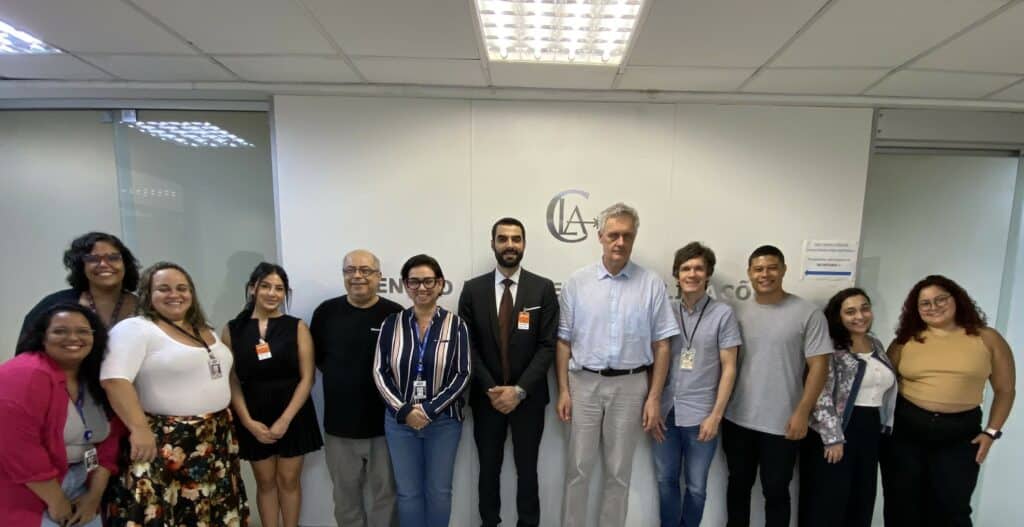
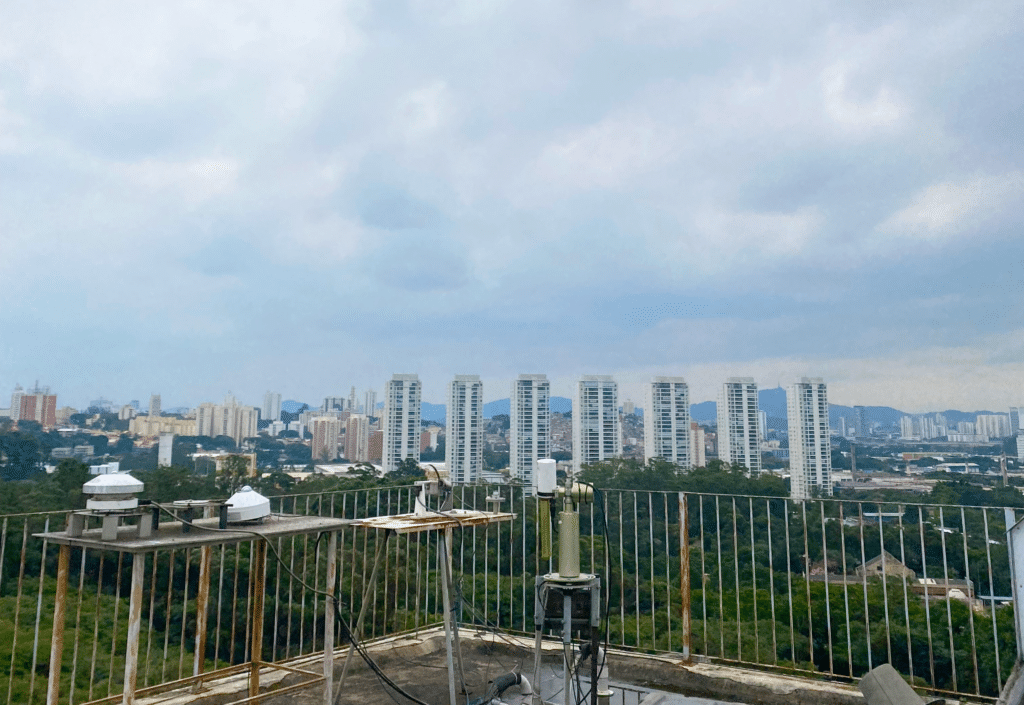
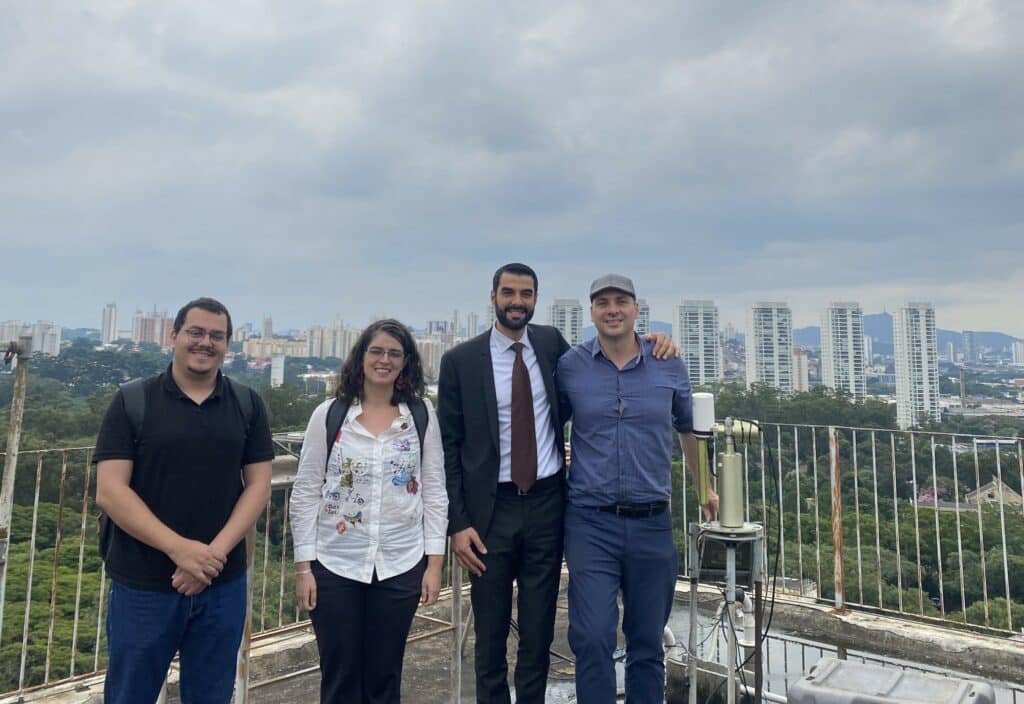
Through a comprehensive agenda created around multiple business possibilities, heavy discussions have been conducted between French companies and other stakeholders. CIMEL, in particular, has actively participated in meetings with significant entities such as the Brazilian Space Agency (INPE), the University of São Paulo, the Institute of Advanced Studies (IPEN), as well as ministers and responsible for finance, cities, energy, and environment.
Encounter with the Remote Sensing experts from the University of São Paulo.
It was particularly interesting for CIMEL to meet these scientific entities in sectors such as space research, advanced technology, and energy, as these areas align closely with CIMEL’s expertise and potential for collaboration and innovation.
CE318 site – University of São PauloCIMEL visiting the University of São Paulo
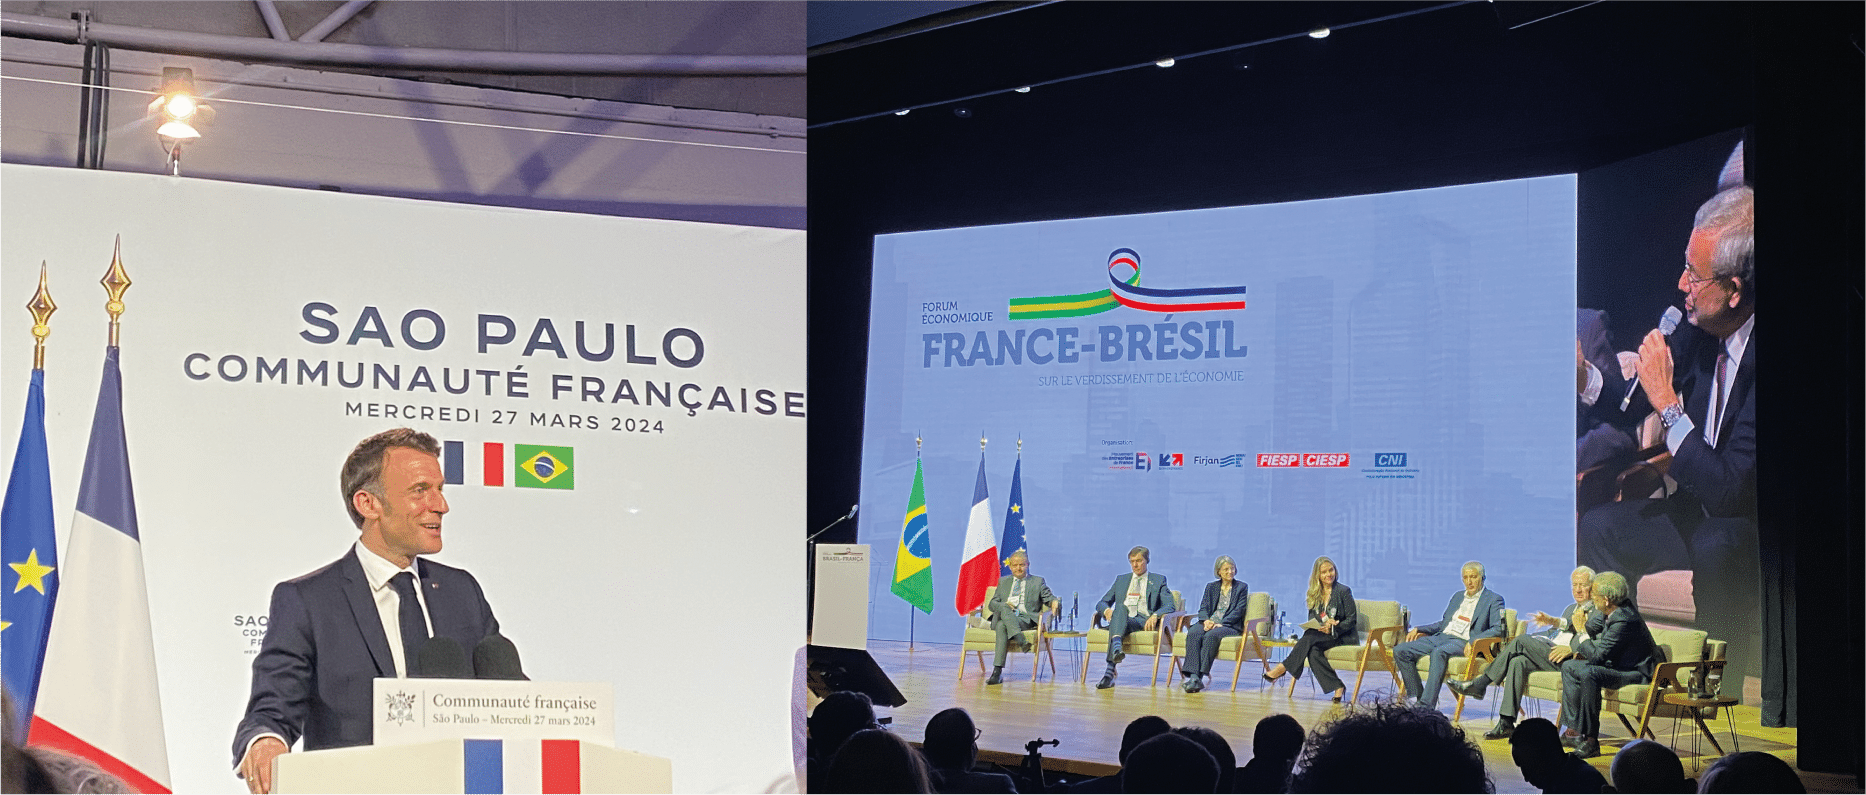
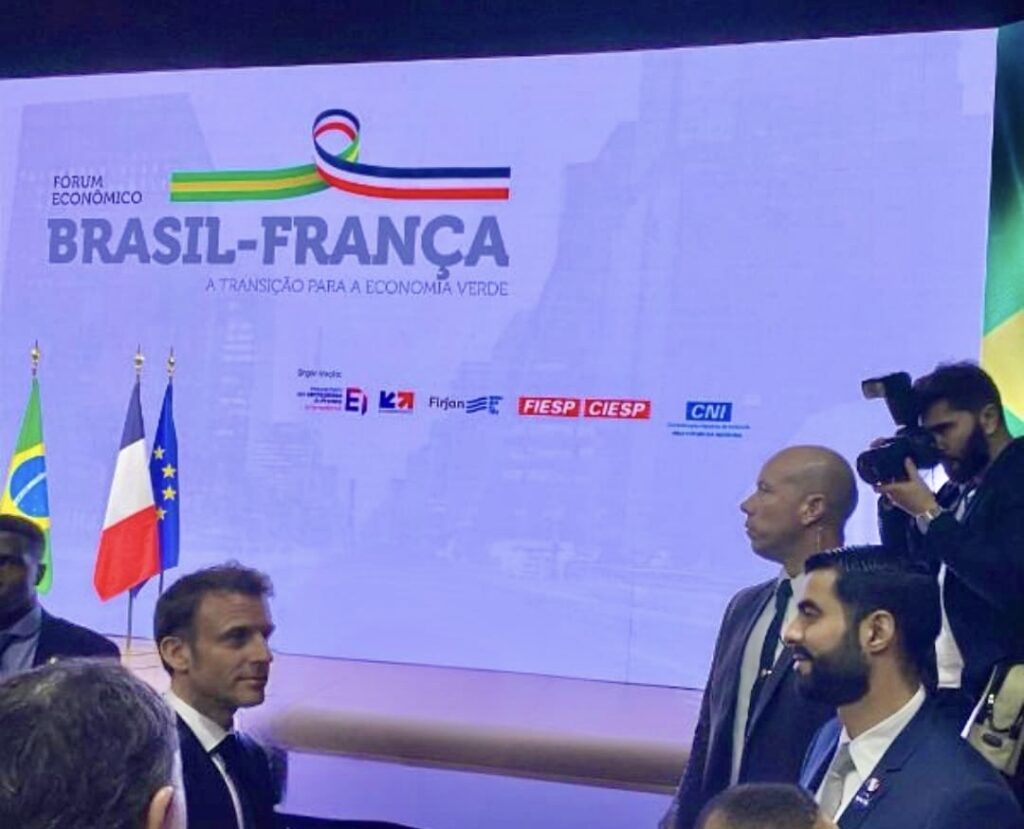
The most popular event of the visit is the Franco-Brazil Business Forum addressing energy transition, which involves President Macron and Geraldo Alckmin – the Vice-President of Brazil. The Forum discussed the initiatives of how the investments will change color into “green” for both governments and revealed plans for sustainable development.
CIMEL meeting the French President during the Business Forum.
The presence of Laurent Saint-Martin, Director General of Business France, brought a decisive vision of the strengths of France with its delegation.
As CIMEL continues to forge ahead in its quest for international expansion, this business trip served as a demonstration of its commitment to innovation, collaboration, and global leadership in the sector of atmospheric and environmental monitoring.
🇫🇷 🇸🇦 | Exciting times for 120 French companies as Business France, led by Franck Riester and in collaboration with the Secretariat General for Investment and the Movement of French International Enterprises, ventures into Saudi Arabia.
Saudi Arabia is undergoing a significant metamorphosis, offering unparalleled opportunities for French companies of all sizes across various sectors. CIMEL is actively contributing to this innovative transformation.
NEOM City, a groundbreaking project, stands as a symbol of Saudi Arabia’s ambition for the future. This futuristic city, focusing on innovation and sustainability, presents immense possibilities for collaboration and investment. CIMEL, recognizing its potential, is actively engaged in discussions and presentations to showcase its expertise in contributing to NEOM’s environmental purposes.
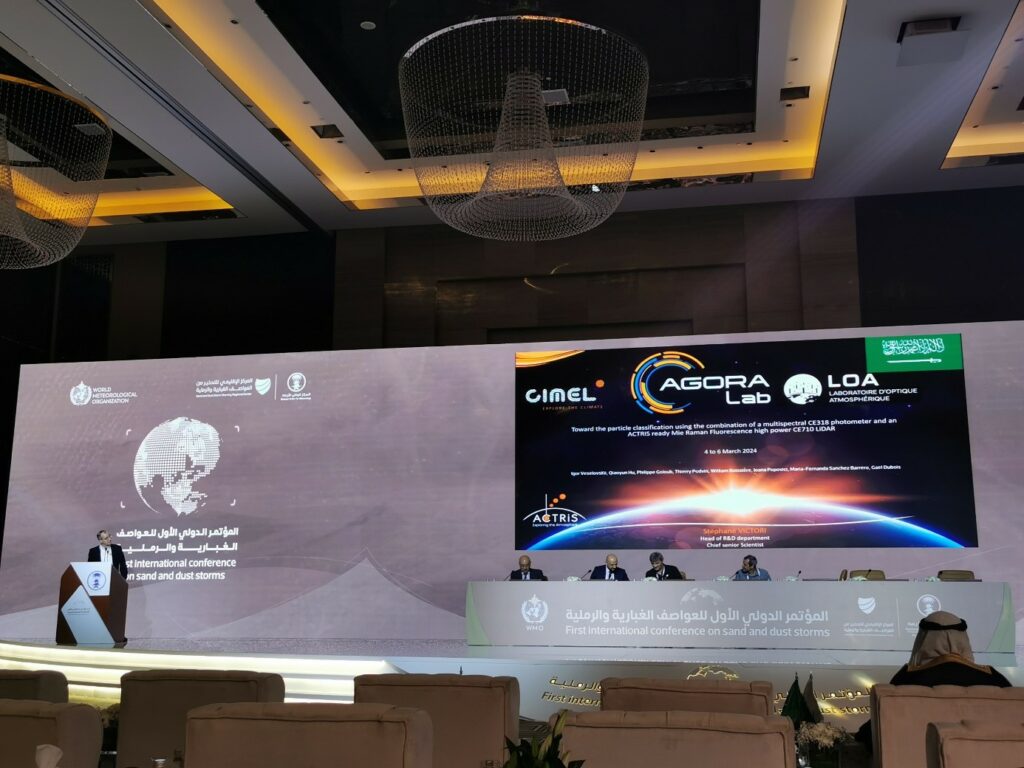
Furthermore, last week marked the beginning of the 1st International Conference on Sand and Dust Storms, hosted by the National Center for Meteorology in #KSA, with CIMEL’s involvement. Follow the three days of lectures at https://youtu.be/rVHzYSVog_U, where CIMEL played a key role in sharing insights and ongoing activities related to #SDS within WMO and the United Nations.
An inspiring week, where CIMEL’s dual commitment to economic transformation and environmental responsibility takes center stage.
Dr. Stéphane VICTORI speech during the First International Conference on Sand and Dust Storms
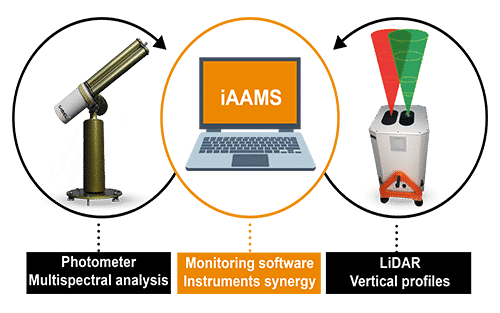
CIMEL was able to explain how our cutting-edge technology enhances aerosols remote sensing capabilities. The synergy between our aerosol photometers and LiDARs, integrated into the iAAMS software, allows for comprehensive data analysis and visualization of aerosols (characterization, location, concentration…). The incorporation of the GRASP algorithm refines aerosol characterization and better concentration profiles, proving invaluable in monitoring sand and dust storms. This technological advancement highlights a collective commitment to economic transformation and environmental responsibility, positioning CIMEL as a key player in a sustainable future.
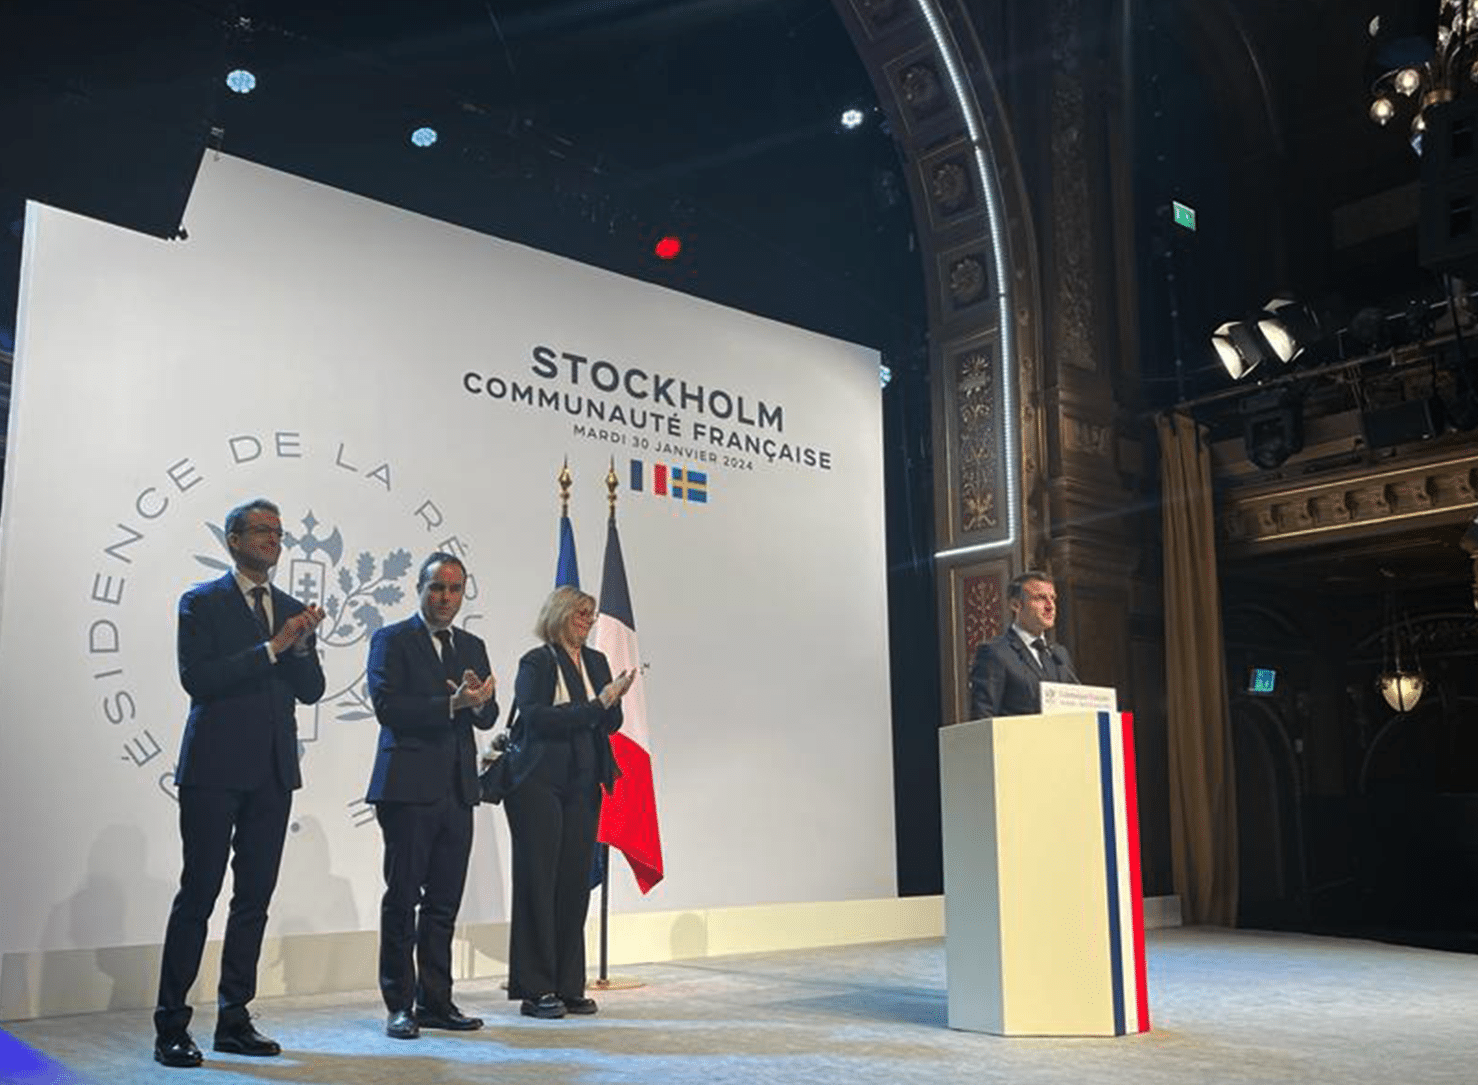
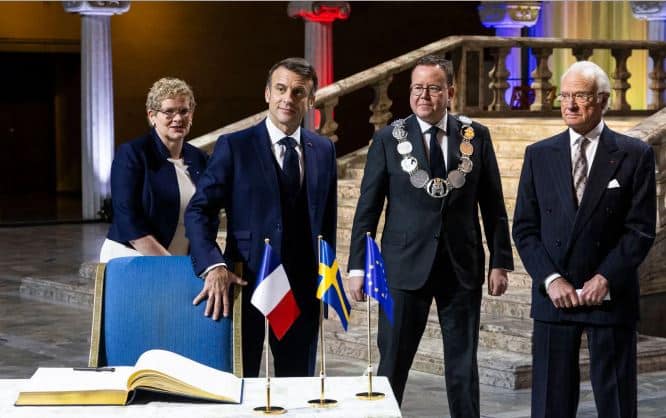
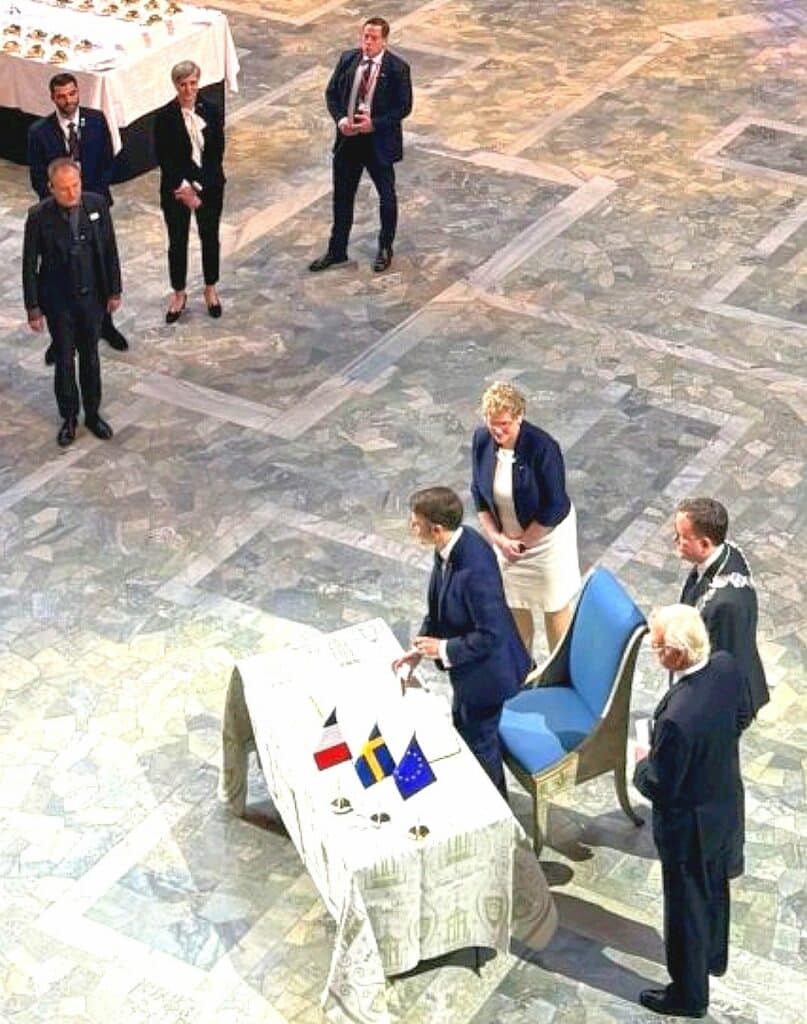
At the invitation of King Carl XVI Gustaf, the French PresidentEmmanuel MACRON, went on a diplomatic state visit in Sweden (Stockholm, Lund and Malmö), organized in collaboration with Business France andBusiness Sweden from January 29th to 31st 2024.
He was accompanied by his wife, Brigitte Macron, ministers of the French government such as Minister of Research Sylvie RETAILLEAU, along representatives of the French Parliament, public authorities, and cultural organizations.
CIMEL is proud to have been part of the French delegation of 12 companies that joined this mission to strengthen relations between France and the Swedish market.
This mission aims to enhance more collaboration on innovation concerning the space industry and ecological transition, where Cimel is fully involved.
CIMEL could demonstrate how our solutions help address challenges related to satellite data validation, air quality and climate change by providing valuable insights and new data. Our objectives are to develop aerosols monitoring networks across Europe, especially through ACTRIS and to bring a strong added value to the air quality application.
A Business Forum organized by Business Sweden took place in Stockholm under the high patronage of King Carl XVI Gustaf. Around 200 Swedish and French business representatives were present for the occasion, with the heads of state and ministers from Sweden and France. Crown Princess Victoria and Prince Daniel graced the delegation with their presence.
Cimel through our Sales and Marketing Director, Idris SANHAJ was able to talk to the French President Emmanuel MACRON about an innovative project that is set to be implemented soon. This will highlight the national strategic technological innovation combined with the recent scientific progress.
By combining climate modeling, through in-situ sensors, our ground remote sensing and satellite data, we allow more accurate air quality forecasting and so decision-making for public health and environmental management.
To summarize, our participation in this mission in Sweden has been immensely fruitful.
We had the privilege of engaging with numerous partners, fostering meaningful connections, and presenting our innovative solutions.
We are grateful for the visibility provided by this mission, which has undoubtedly contributed to expanding our presence in the global market and advancing our mission to address critical environmental challenges through cutting-edge and made-in-France solutions.
On the night of Wednesday, August 22, 2018, the CIMEL’s micro-LiDAR flew for the first time in a stratospheric balloon for the validation of the project, from Timmins Air Force Base, in Ontario (Canada).
Stratéole-2 is a program of observation of the dynamics of the atmosphere in the intertropical zone developed in partnership between CNRS and CNES. TheLATMOS (Atmosphere, environment and space observations laboratory) through its joint laboratory with CIMEL: CIEL), the LMD (Dynamic Meteorology Laboratory), and the CSA (Canadian Spatial Agency) are also collaborating on this project.
This Stratéole-2 project called BECOOL (BalloonbornECirrus and convective overshOOt Lidar) mainly consists in placing CIMEL’s micro-LiDARs in stratospheric hot-air balloons and flying them around the world. The onboard aerosols micro-LiDARs emit lasers downwards, contrary to the initial use (the shots are normally done from the ground towards the atmosphere).
The project Stratéole-2 represents several challenges as CIMEL had to develop, in collaboration with the LATMOS a micro-LiDAR prototype that must correspond to the following standards:
Weighting less than 7 kg
Consuming less than 10 W
Resisting harsh temperature conditions
Indeed, CIMEL’s LiDARs are well known for their robustness and energetic Self-reliance which allows low maintenance: practical when the LiDARs are up to 20km in the stratosphere!
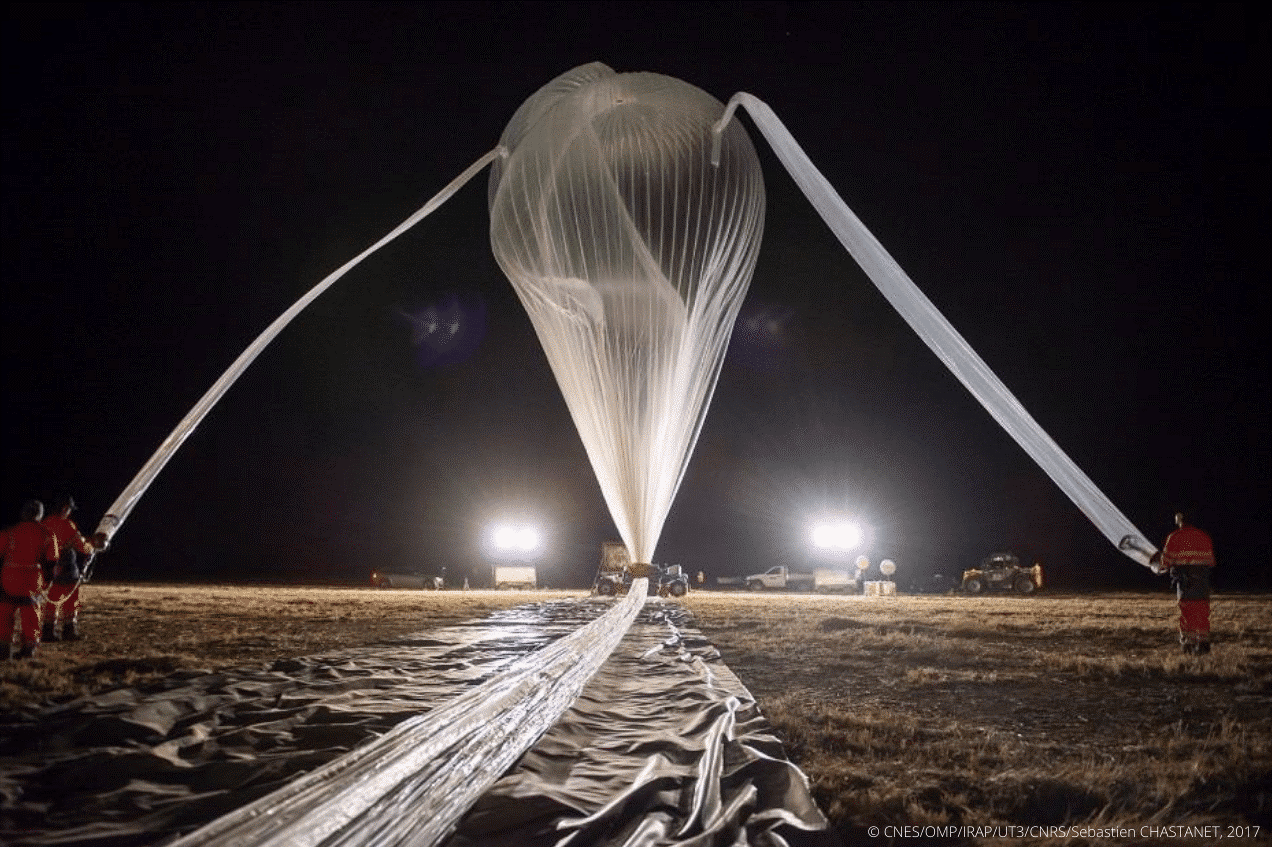
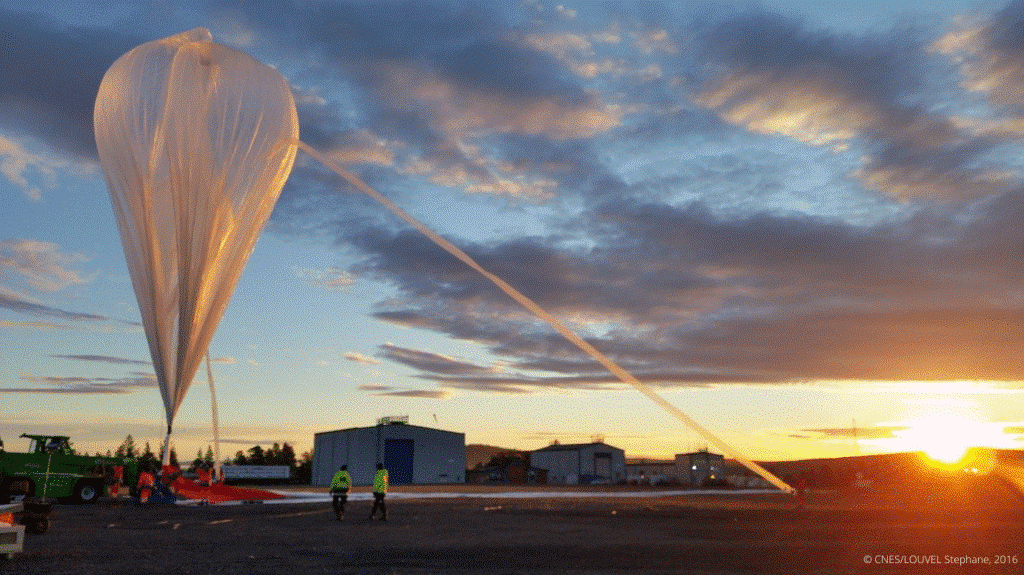
Figure 1: Preparation of a stratospheric balloon before the takeoff
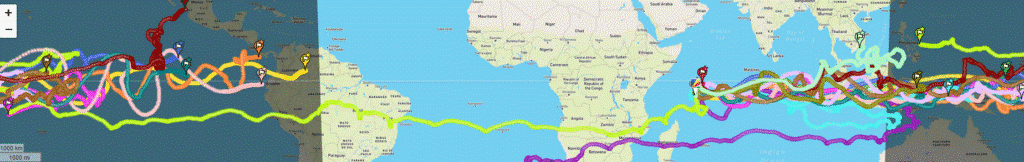
The program uses stratospheric pressurized balloons filled with helium 11 to 13 meters in diameter. During 3 to 4 months, they are carried by the winds all around the tropical belt and are propelled up to 20 kilometers in the atmosphere. Some can travel across 80,000 kilometers around the world (Figure 2).
The project includes a total of three measurement campaigns realized between 2018 and 2025. Contrary to the previous one which served as a validation (and in which 2 micro-LiDARs were released), the second campaign was for scientific purposes. It started in mid-October 2021 and ended in April 2022, 3 micro-LiDAR balloons were released into the atmosphere from the Seychelles (Mahé). They collected valuable information which will then be analyzed for the study of atmospheric phenomena and their role in the climate. The third campaign is planned for 2025, with a further 4 micro-LiDAR balloons that will be released.
The objectives are to try to clarify some of the grey areas that hinder our detailed understanding of the atmosphere and its role in the Earth’s climate. BECOOL allows scientists to study atmospheric dynamics and composition such as convection or the dynamic coupling between the troposphere and the stratosphere. Exchanges and air movements between these two atmospheric layers are important and influence the whole planet.
However, the tropical region is difficult to access. Consequently, the classical methods of observation (by satellites, by plane, …) are not enough. This is why using balloons is strategic: they are the only ones able to observe these phenomena in real time and very closely to the atmosphere.
“It is a completely original mode of sampling, which is not obtained otherwise and allows results of unequaled finesse” (A. Hertzog).
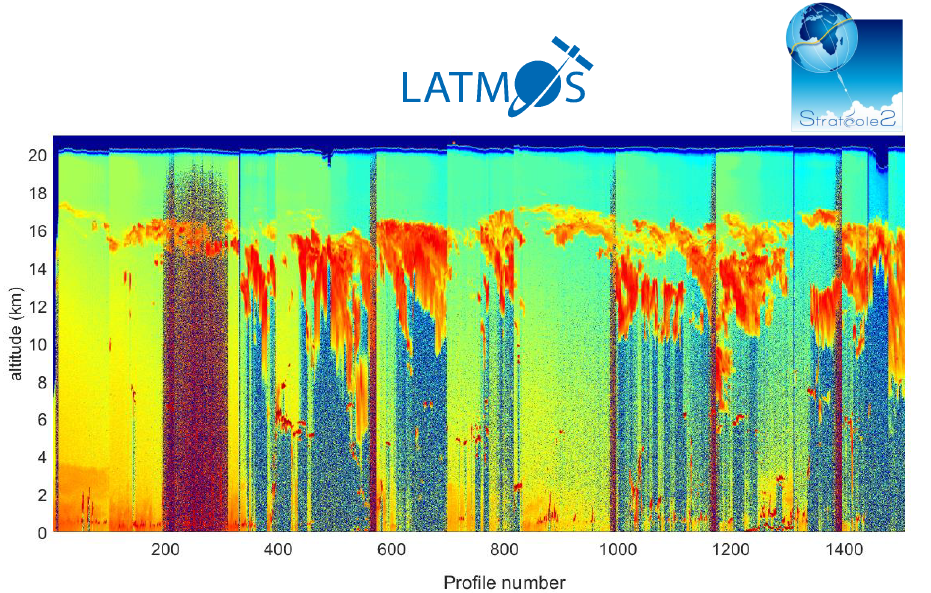
Below is a quicklook from a Stratéole-2 micro-LiDAR taken from a balloon.
Figure 3: Quicklook LATMOS-Stratéole 2018
Bibliography:
E. J. Jensen et al, Bull. AMS, 129-143 (2017), M. McGill et al., Appl. Opt., (41) 3725-3734 (2002), J. S. Haase et al., Geophys. Res.L., 39, (2012), P. Zhu et al., Geos. Inst. Meth. and Data Systems, 89-98, (2015) J.-E. Kim et al, Geophys. Res. L. (43), 5895-5901 (2016), S. Davis et al., J.Geophys Res, 115 (2010) S. Solomon et al., Science (327), 1219-1223 (2010) V. Mariage et al., Optics Express 25 (4), A73-A84 (2017) ,G. Di Donfrancesco et al., Appl. Opt. (45) 5701-5708 (2006) https://doi.org/10.1051/epjconf/202023707003
François Ravetta, Vincent Mariage, Emmanuel Brousse, Eric d’Almeida, Frédéric Ferreira, et al. BeCOOL: A Balloon-Borne Microlidar System Designed for Cirrus and Convective Overshoot Monitoring. EPJ Web of Conferences, EDP Sciences, 2020, The 29th International Laser Radar Conference (ILRC 29), 237, 07003 (2p.). ff10.1051/epjconf/202023707003ff. ffinsu-02896973f
CIMELin the French delegation of the French President on his mission in China.
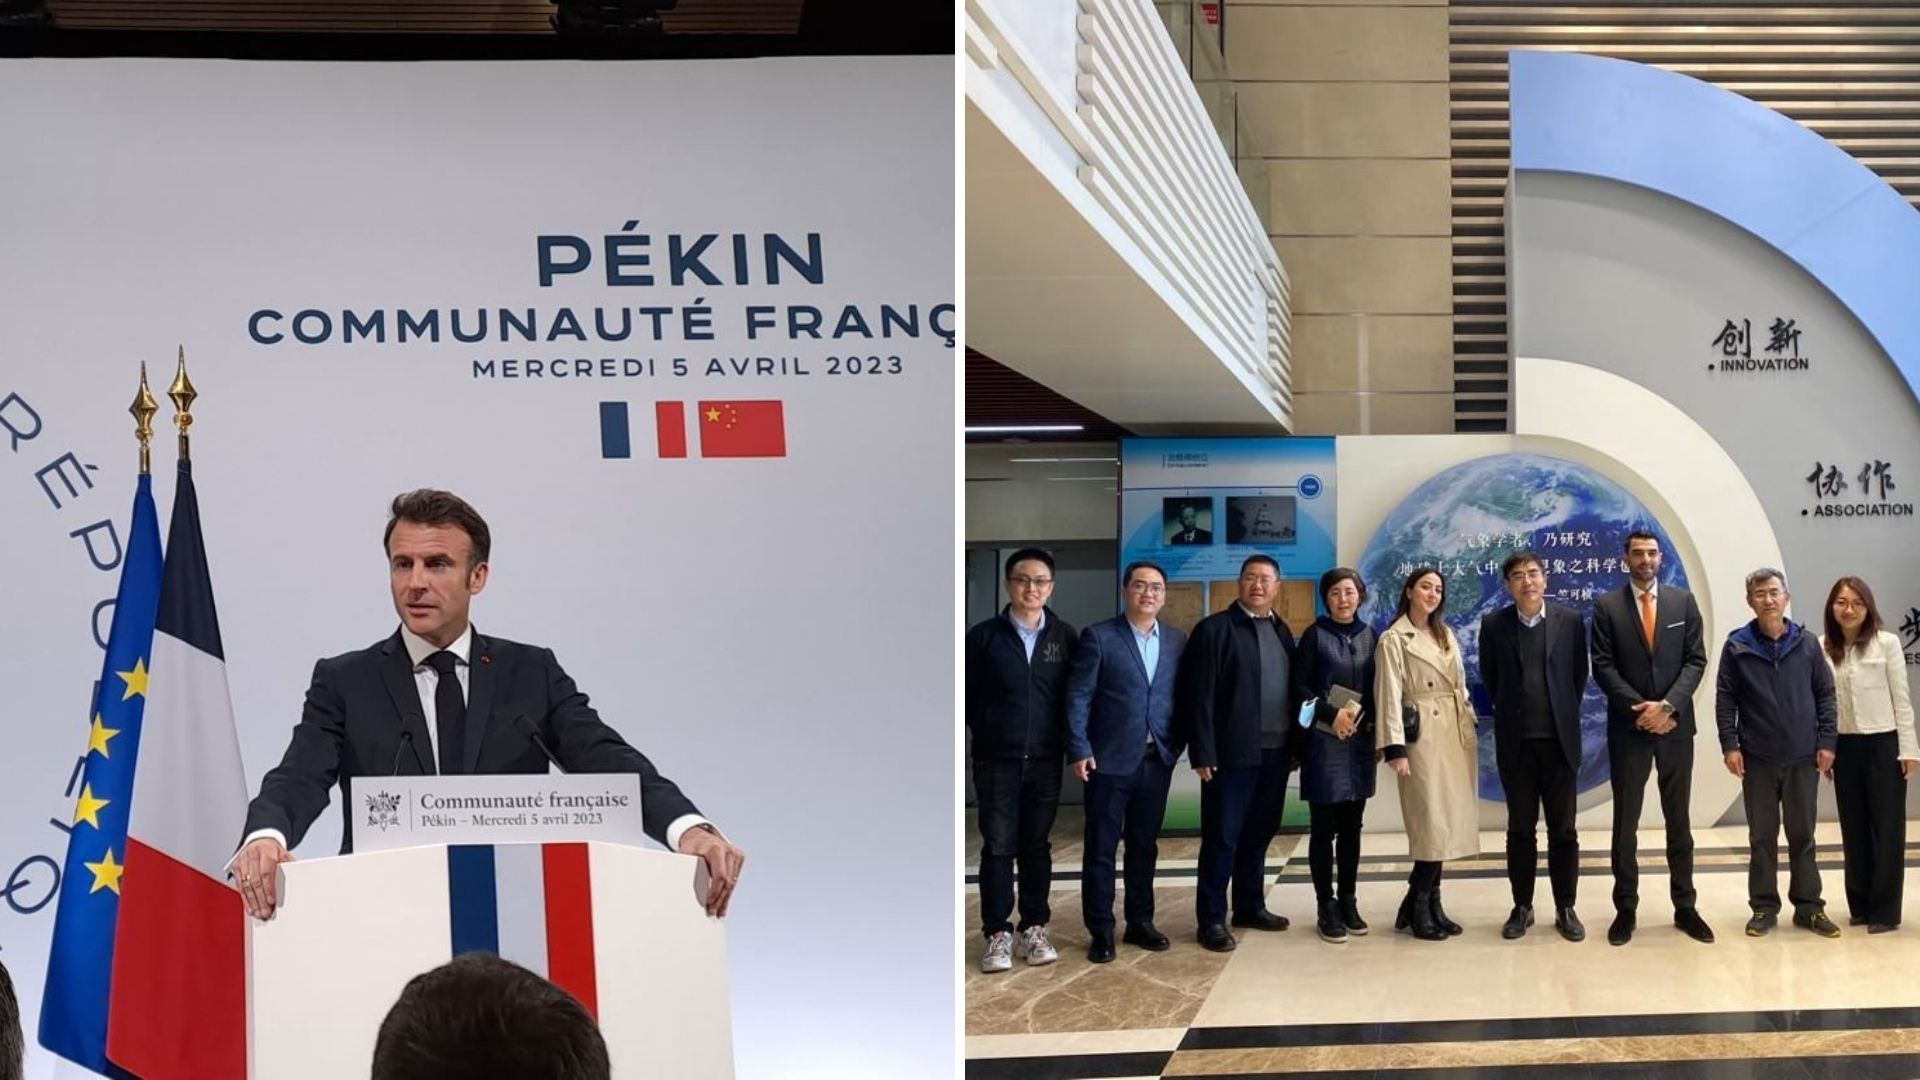
CIMEL is proud to have accompanied the French President Emmanuel Macron on his mission in China, organized in collaboration with Business France and the French Embassy from April 3rd to 7th 2023.
This was an important geopolitical event, as we were part of the first French delegation to come back in China after the reopening of the borders and the lifting of sanitary restrictions linked to COVID-19.
It was also an opportunity for companies such as ours (with special regards to Chromatotec, ENVEA Group, Greentech Innovation) to shine through lobbying and gathering decision makers on climate change and environmental issues.
Our Sales and Marketing Director, Idris SANHAJ and our International Business Developer Laura MARIT have represented CIMEL through business meetings with our Chinese partners (CMA Chinese Meteorological Agency, CAS Chinese Academy of Sciences, Environmental Monitoring Centers of Shanghai Municipality and Jiangsu Province, Guangzhou University…) and to exchange ideas with various members of the French delegation organized by Business France.
They had the opportunity to encounter the French President Emmanuel Macron and had a brief meeting with the Minister of Economy and Finance Bruno Lemaire to discuss the future of air quality application with our innovative solutions, in particular for the JO2024 Olympic Games in Paris.
During this mission, CIMEL has presented its remote sensing solutions for aerosols monitoring, used to increase the understanding of atmospheric phenomenas, improve and validate air quality models.
This combination of climate modeling, through in-situ sensors, satellite data, and ground remote sensing, allows for more accurate air quality forecasting and decision-making for public health and environmental management.
We look forward to continuing to serve our customers in China and across the globe with the same level of excellence and dedication that has become synonymous with our brand Made in France.
🙏 We extend our gratitude to Business France (Laurent Saint-Martin, Xavier CHATTE-RUOLS, Baptiste DELBENDE, Nicolas SESTIER), teamfranceexport (Valérie Alvarado-Zongo, Yang Yang, Michelle Portugal, Lian Qu), and CCI FRANCE CHINE (Caroline Penard, Christophe Lauras) for coordinating this successful business trip.
The Cyprus Institute is non-profit research and educational institution with a strong scientific and technological orientation.
The Institute is divided into four research centers:
Energy, Environment and Water Research Center (EEWRC)
Science and Technology in Archeology and Culture Research Center (STARC)
Computation-based Science and Technology Research Center (caSToRC)
Climate & Atmosphere Research Center (CARE-C)
The Climate and Atmosphere Research Center (CARE-C) was founded at the Cyprus Institute in January 2020. It is a regional European Center of Excellence for Climate and Atmosphere Research, based in Cyprus, for the Eastern Mediterranean and Middle East (EMME) region. The aim of the center is to lead some researches about urgent climate change and air pollution challenges such as greenhouse gases, the water cycle, extreme weather, atmospheric dust and their impacts.
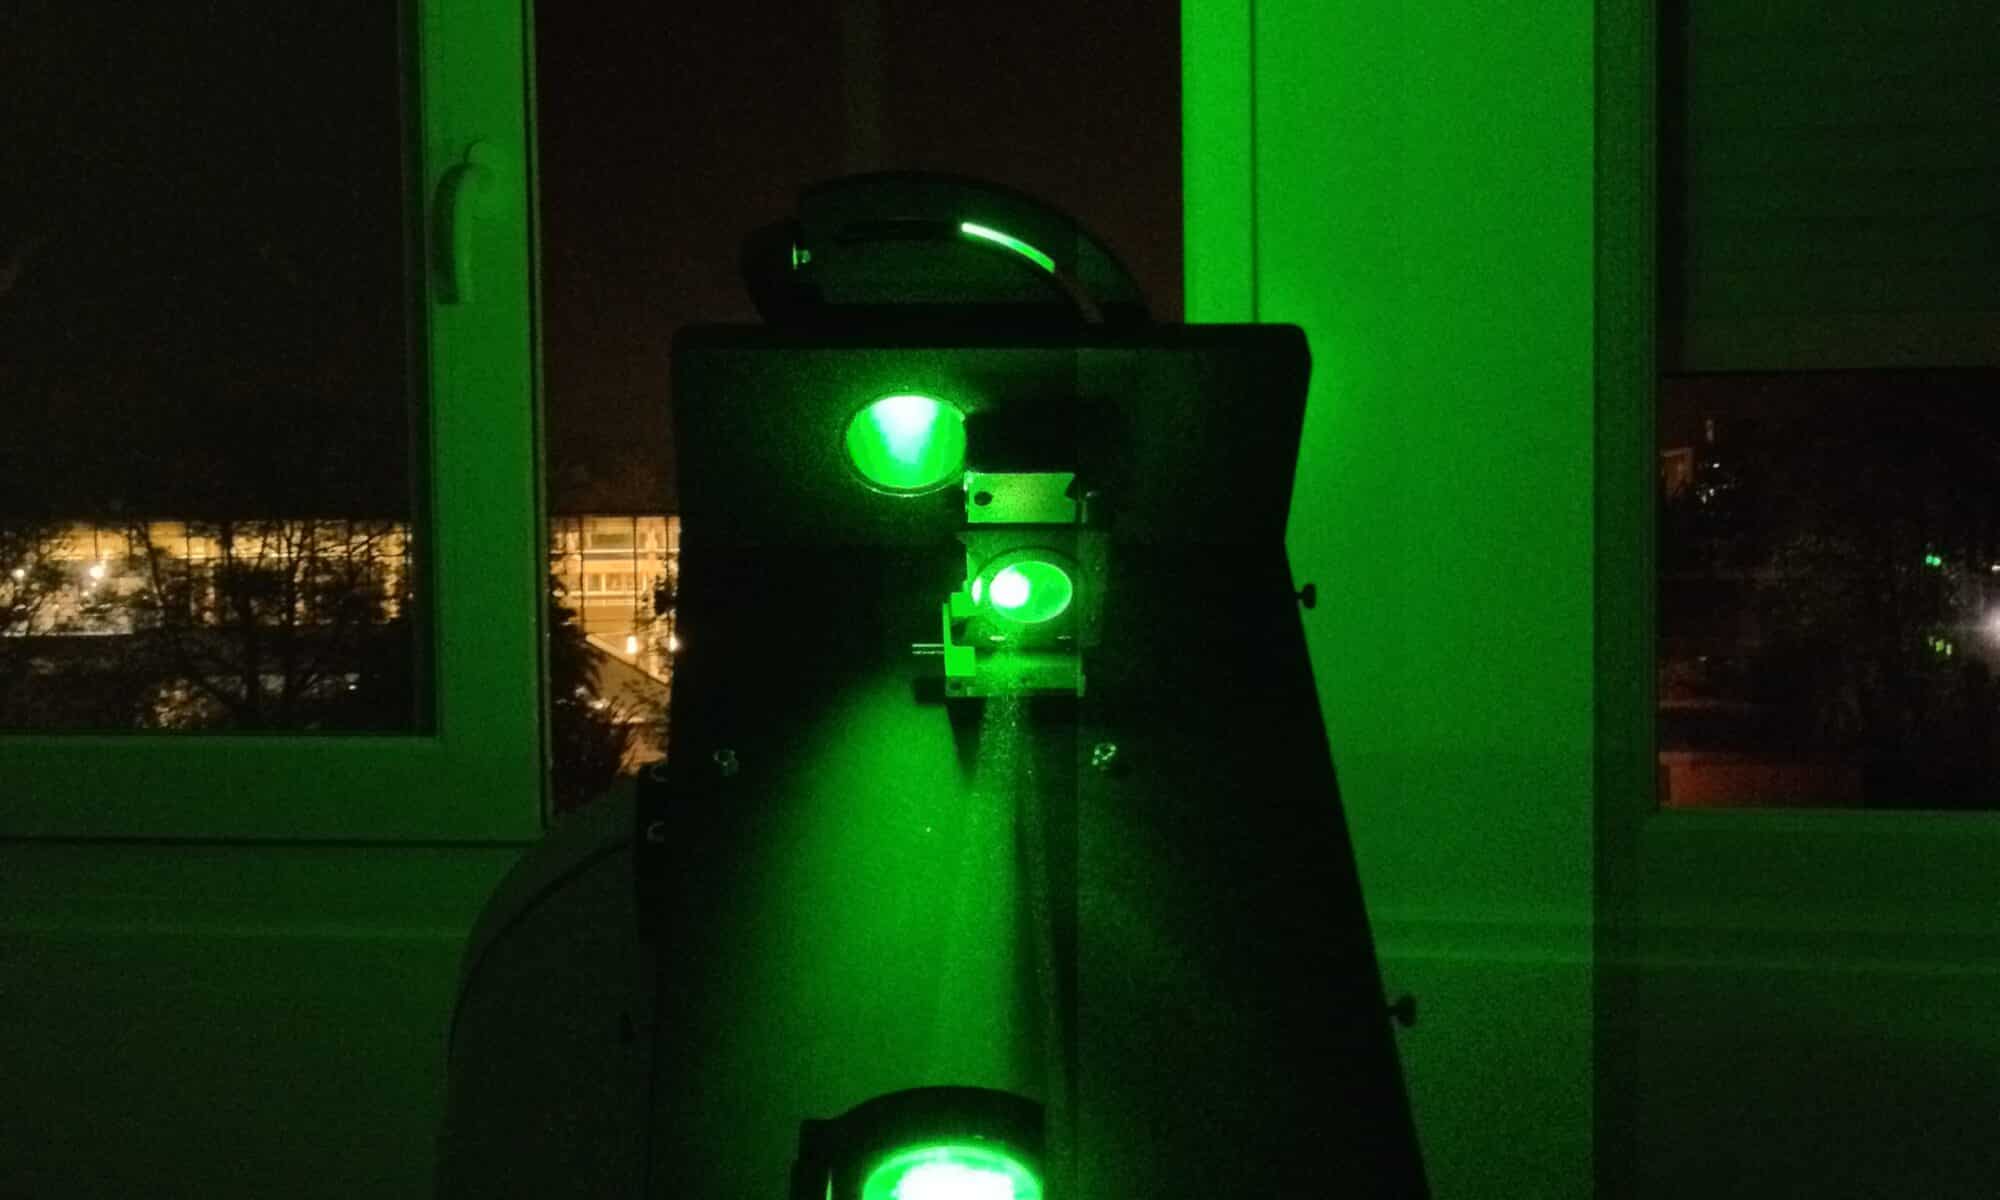
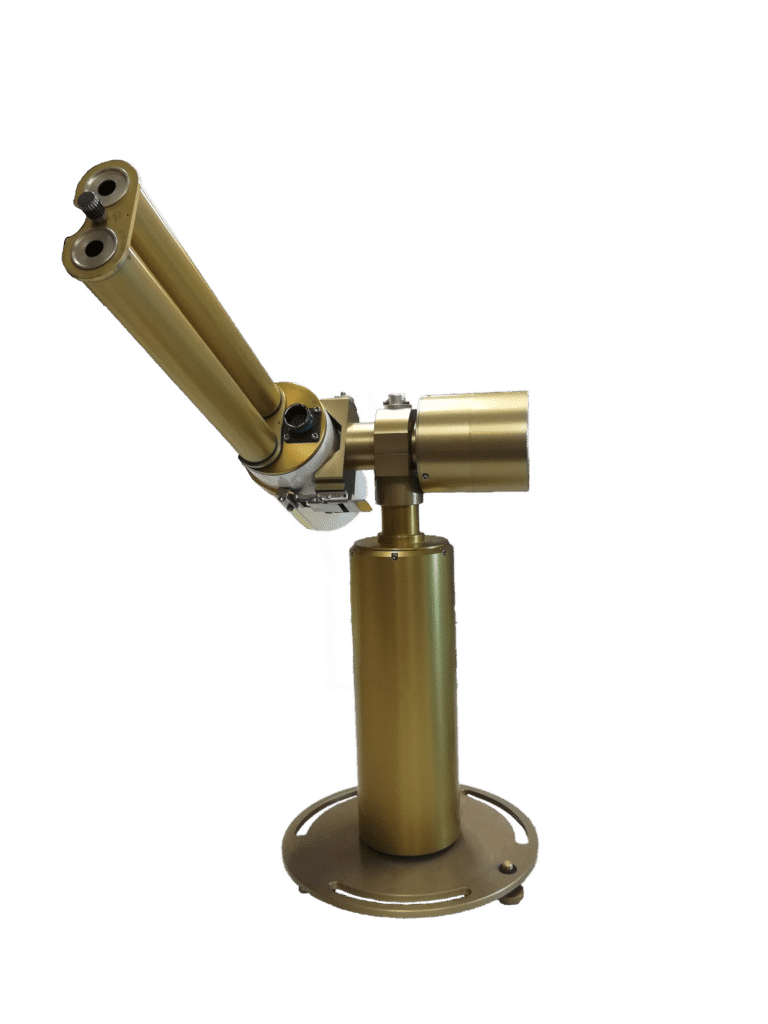
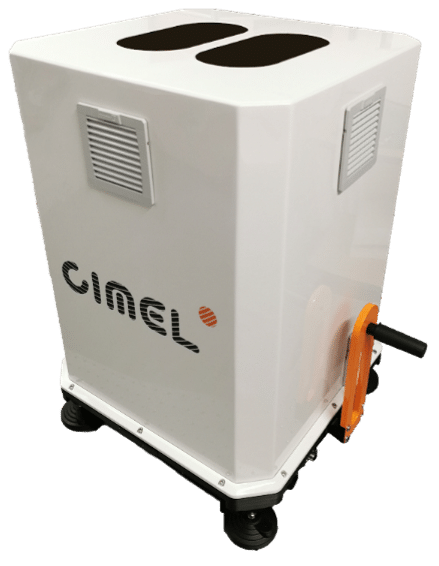
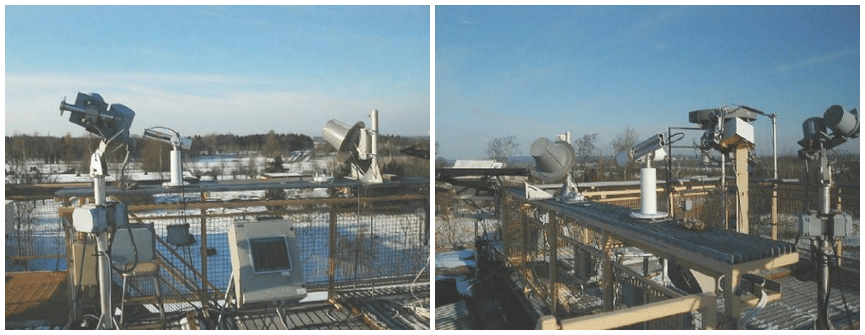
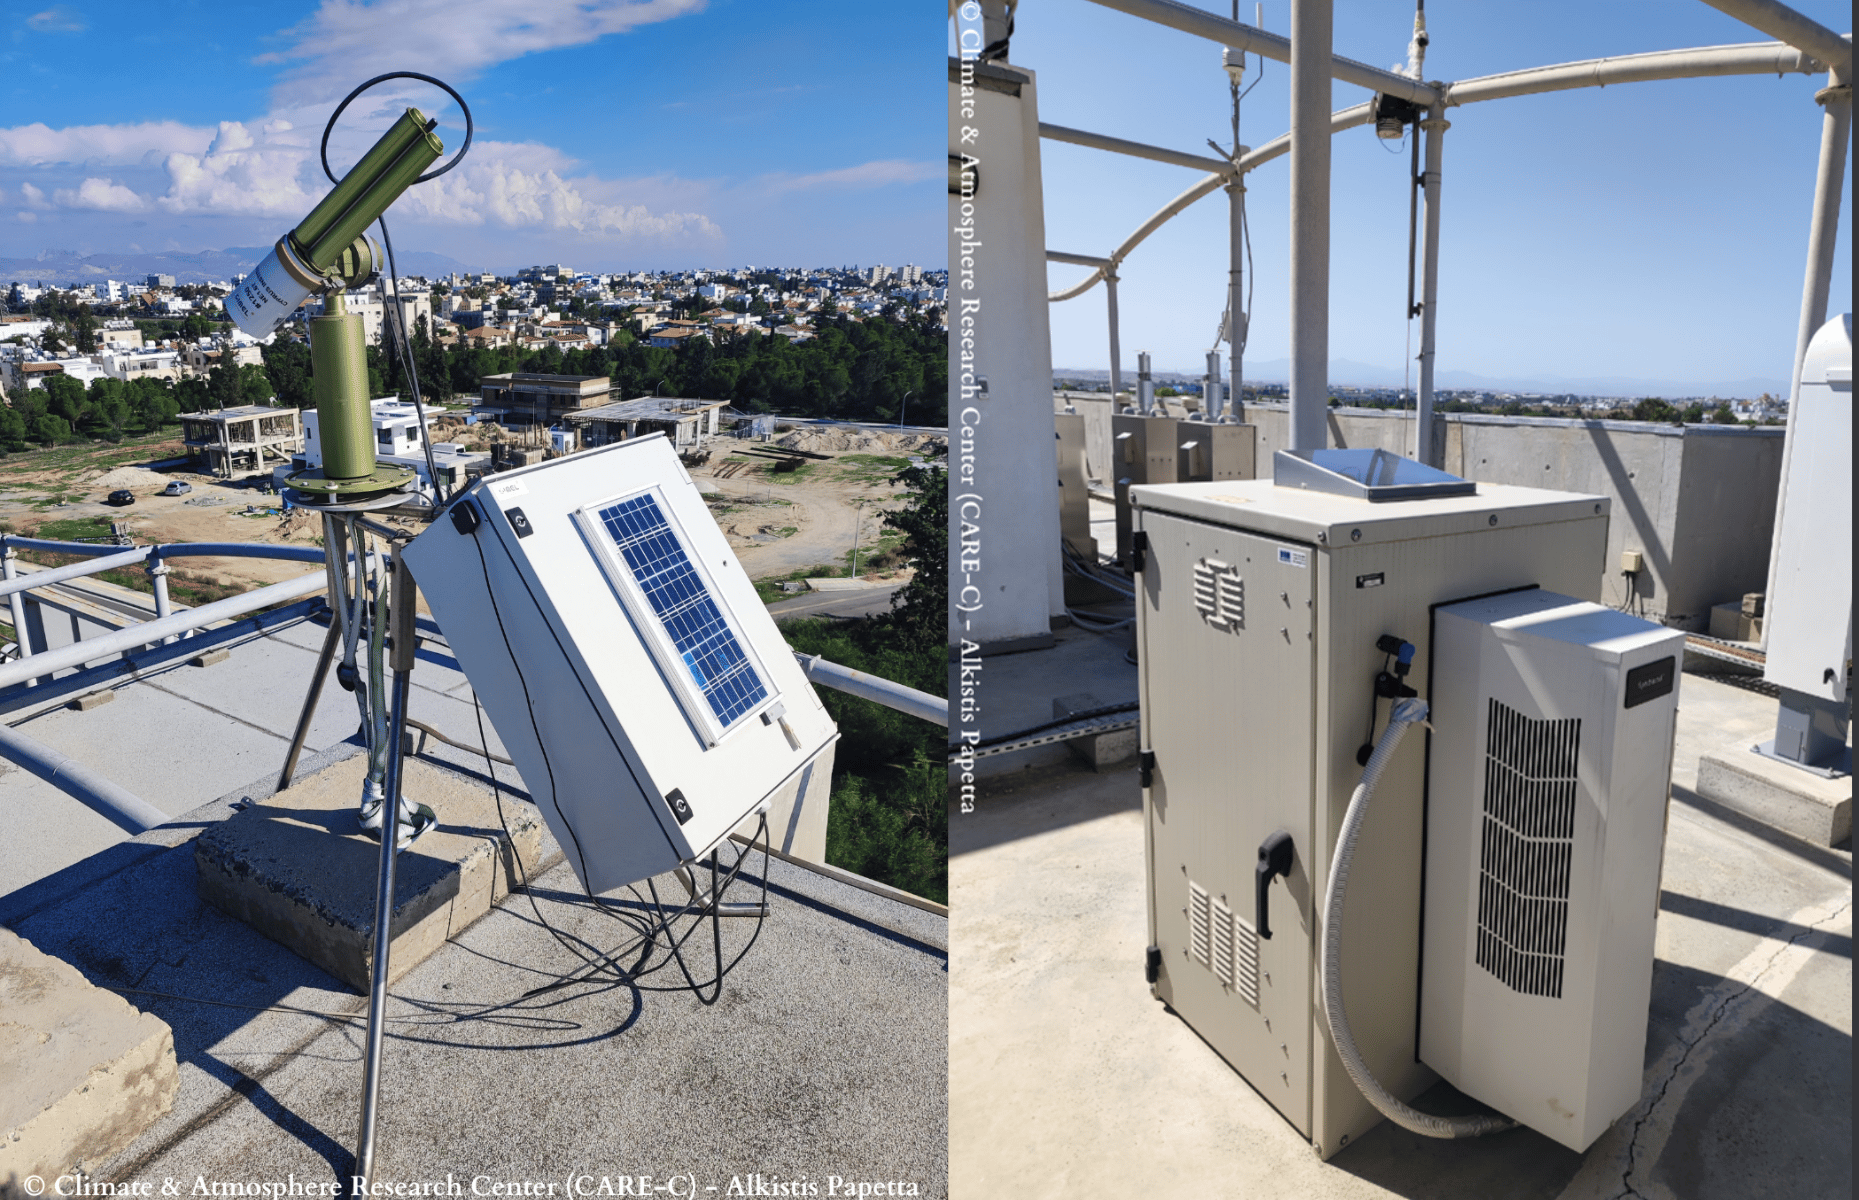
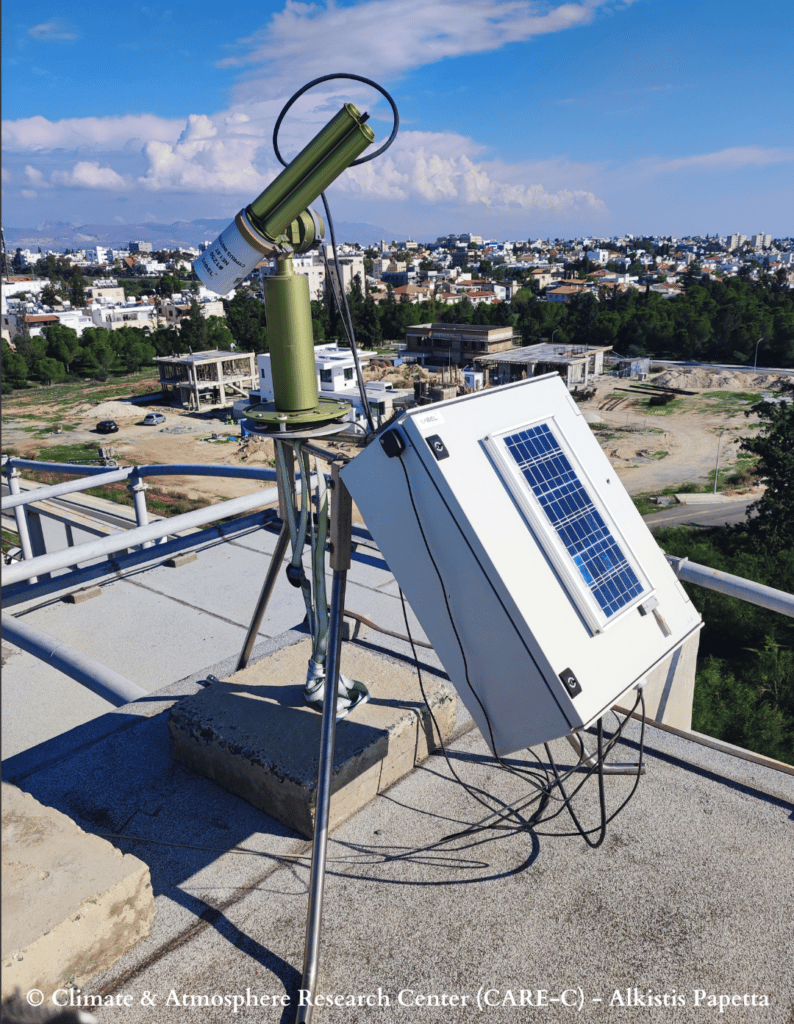
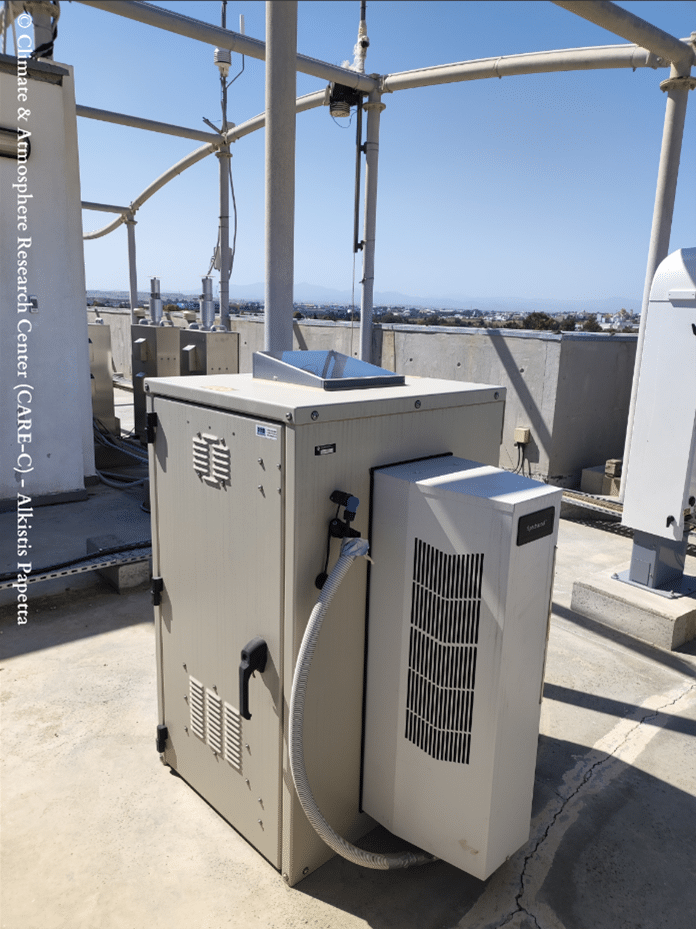
Therefore, the center owns a remote sensing group composed by a network of ground-based instruments located at three Cyprus Atmosphere Observatory (CAO) stations: Nicosia, Agia Marina Xyliatou and Troodos. Among these instruments, three CE318-T – Sun Sky Lunar Multispectral Photometersand a CE376 – Compact LiDAR.
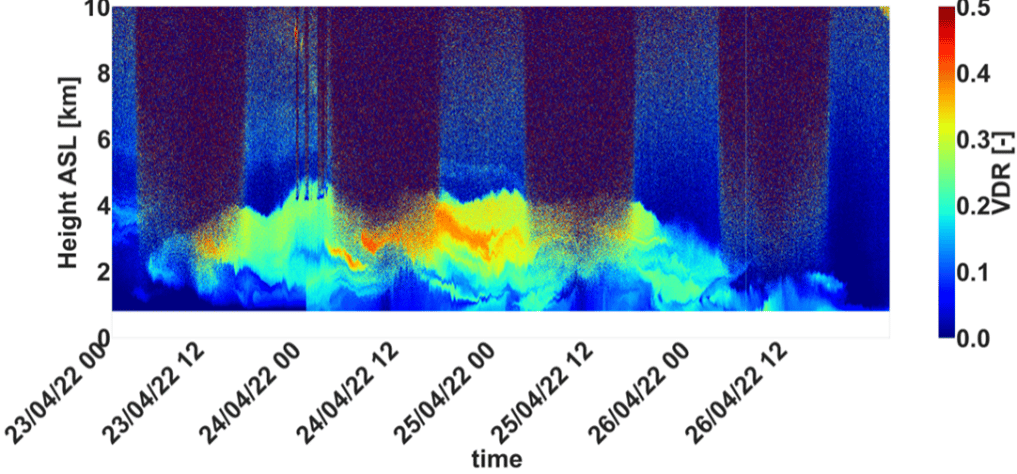
CIMEL AAMS – Automatic Aerosol Monitoring Solutionallows the study of the transportation of pollution, dust, smoke and all the aerosols related to atmospheric composition. For instance, optical characterization of dust and smoke particles are made thanks to the 2 wavelengths CE376 – Compact LiDAR. In addition,the instrument has depolarization capability, which is a relevant information for aerosols typing.
By using state-of-the-art solutions and collaborating with the Laboratoire d’Optique Atmosphérique (LOA – University of Lille/CNRS), the CAO provides high quality, long-term observations of key atmospheric pollutants relevant to air quality and climate change, and thus, brings value to the Cyprus Institute in different sectors such as Research, Innovation and Education. This collaboration is developing for many years in the frame of aerosol monitoring (AERONET), radiative flux monitoring and more recently with automatic Lidar/photometer synergy, in the frame of ACTRIS. Moreover, the cooperation between LOA and CAO, in the frame of AQABA campaign, allowed the first operation of the prototype shipborne version of CE318T.
Figure 1 : CE318-T – Sun Sky Lunar Multispectral photometer at Nicosia station.
Figure 2 : CE376 – Micro LiDAR at Nicosia station.
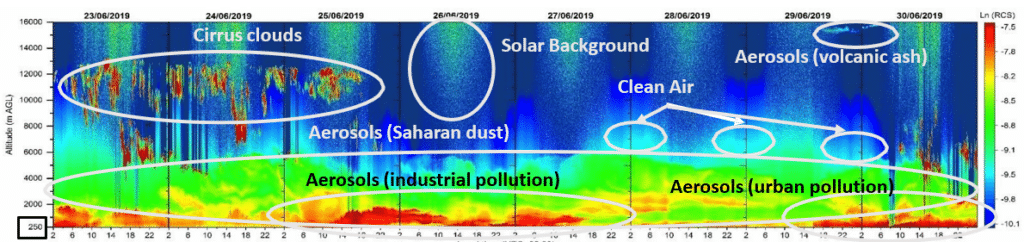
Figure 3 : Quicklook of the volume depolarization ratio during a dust event in Cyprus.
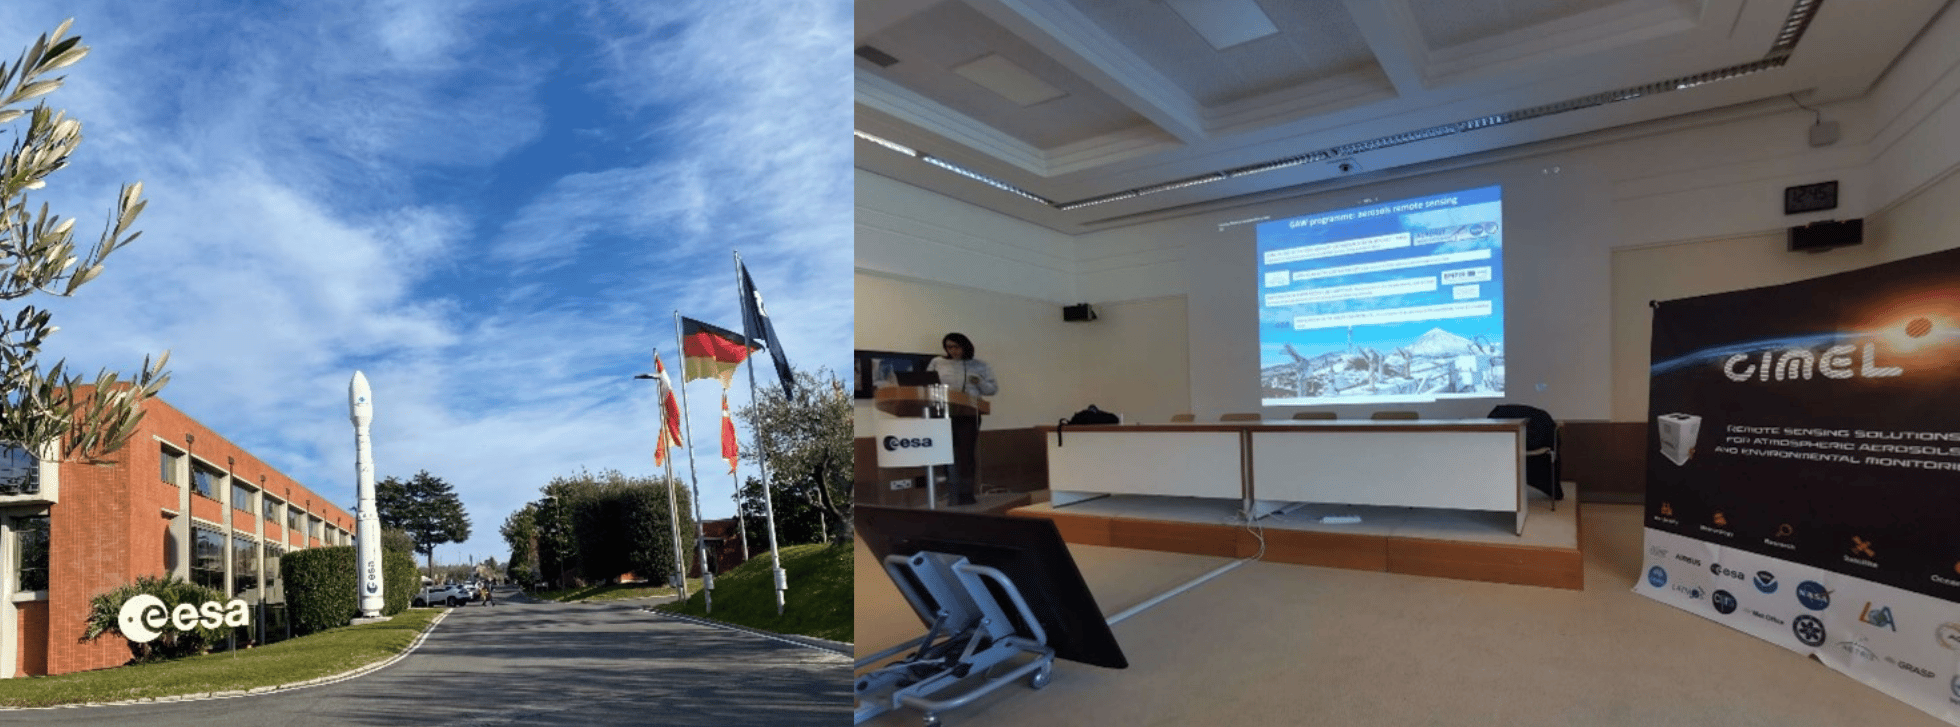
SOlar Radiation Based Established Techniques for aTmospheric Observations (SORBETTO) Winter school took place from February 6th to 10th atESA-ESRIN(European Space Research Institute), in Frascati, Italy and was organized in collaboration with Sapienza University(Roma) and CNR-ISAC (National Research Council – Institute of Atmospheric Sciences and Climate).
SORBETTO is an important training event for young researchers collaborating within the international aerosol’s scientific community (gas and aerosol observations for climatological, meteorological, local and global air pollution studies, remote sensing and in-situ measurements, calibration of satellite measurements…).
Ground-based instruments deployed in Networks such as AERONET are key players to perform high quality observations that contribute to the Validation and Calibration (CAL/VAL) of satellite missions. Instruments such as Sun Sky Lunar Photometers or LiDARs allow to check that information derived from satellite sensors is comparable to ground measurements and thus, to validate their accuracy.
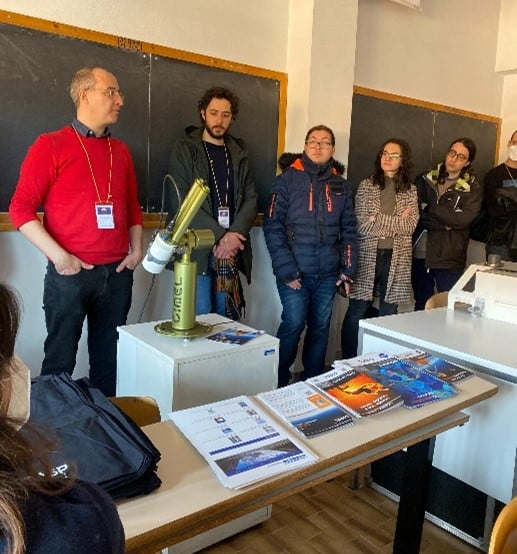
CIMEL Team operating an instrumental demonstration of CE318-T Sun Sky Lunar Photometer at University of Sapienza, 9th 2023.
The instrument show held on Thursday 9th at Sapienza University was the opportunity for students to attend a presentation of various solutions such as CIMEL CE318-T Sun Sky Lunar Photometer, exclusive instrument of NASA Aerosol Network AERONET.
It was a pleasure for CIMEL to attend the event with our great and exclusive Italian Business Partner XEarPro Srl. With 20 years of experience in the field of environmental monitoring, XEarpro Srl contributes in the development of applications and solutions to safeguard the environment around us. We collaborate closely to meet the needs of the Italian scientific community in term of aerosols remote sensing instruments.