
CIMEL CE376 Lidar Strengthens Aerosol and Dust Monitoring at the Cyprus Institute
Nicosia, Cyprus – June 2025
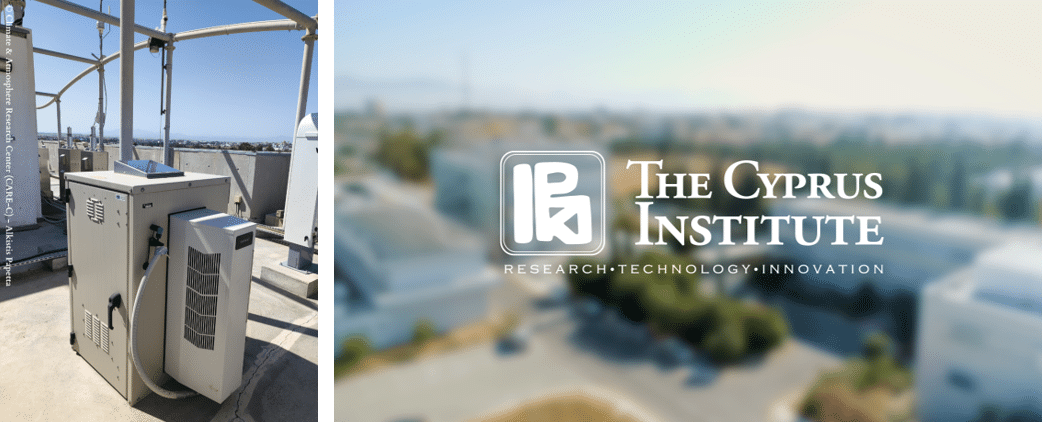
TThe Cyprus Institute’s Climate and Atmosphere Research Center (CARE-C) continues to enhance its atmospheric observation capabilities with the CIMEL CE376, a compact, automatic aerosol lidar system providing high-resolution vertical profiles of aerosols and dust over the Eastern Mediterranean.
Installed on the institute’s rooftop platform, the CE376 has been operating continuously since late 2021, supporting advanced research and real-time environmental monitoring as part of the EMME-CARE project.
Advanced Technical Features:
- Dual-wavelength operation at 532 nm and 808 nm.
- Polarization channel at 532 nm for depolarization ratio retrievals.
- Vertical range: Up to 10 km in daytime and 18 km at night.
- Vertical resolution: 15 m; Temporal resolution: 1 s.
This system is designed to be compact and energy-efficient, suitable for continuous, remote, and even mobile operations — ideal for climate-sensitive regions like the Eastern Mediterranean and the Middle East.
Accurate Dust and Aerosol Profiling
The CE376 provides real-time vertical profiles of:
- Particle backscatter and extinction coefficients
- Volume depolarization ratios for aerosol typing
- Planetary boundary layer (PBL) height estimation
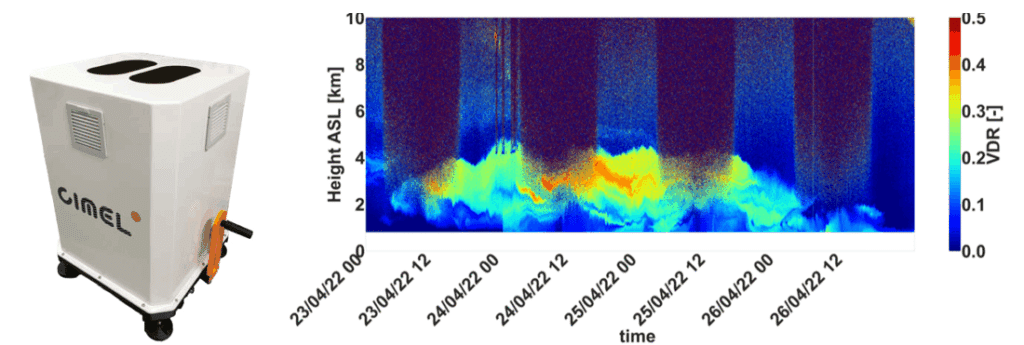
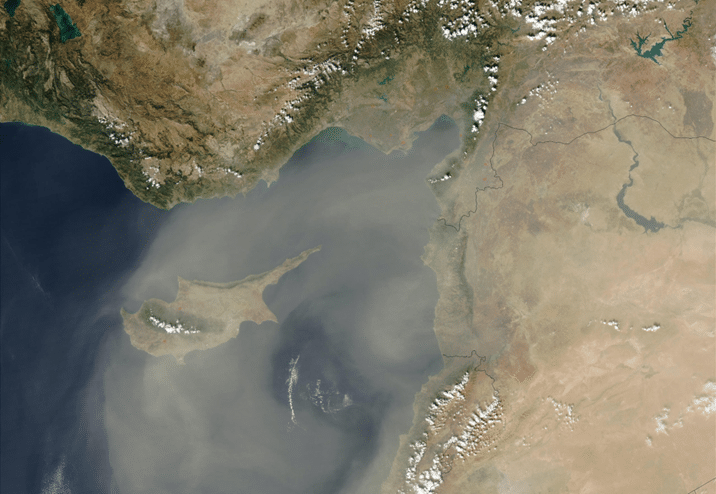
Recent observations show the lidar’s capacity to clearly distinguish between clean atmospheric layers and dust intrusions originating from North Africa. Notably, during spring 2024, several Saharan dust events were recorded over Cyprus, with elevated layers reaching above 5 km and enhanced depolarization ratios indicating non-spherical particles consistent with mineral dust.
Calibration and Data Quality
An internal calibration and data correction procedure has been implemented to ensure the high accuracy of depolarization ratio measurements. Molecular depolarization values are now well-aligned with theoretical expectations (~0.0033), allowing for robust identification and classification of aerosol types.
The processed and corrected data are openly available via the Cyprus Institute’s EMME-CARE Upper-Air Data Portal, providing the scientific community and policymakers with vital insights into aerosol dynamics, air quality, and climate interactions across the region.
The site also hosts a CIMEL CE318-T photometer as part of the AERONET network, enabling valuable synergy with the CE376 for improved aerosol classification and dust monitoring.
Explore real-time data here: https://emme-care.cyi.ac.cy/data/upper-air-over-cyprus/


.jpg)