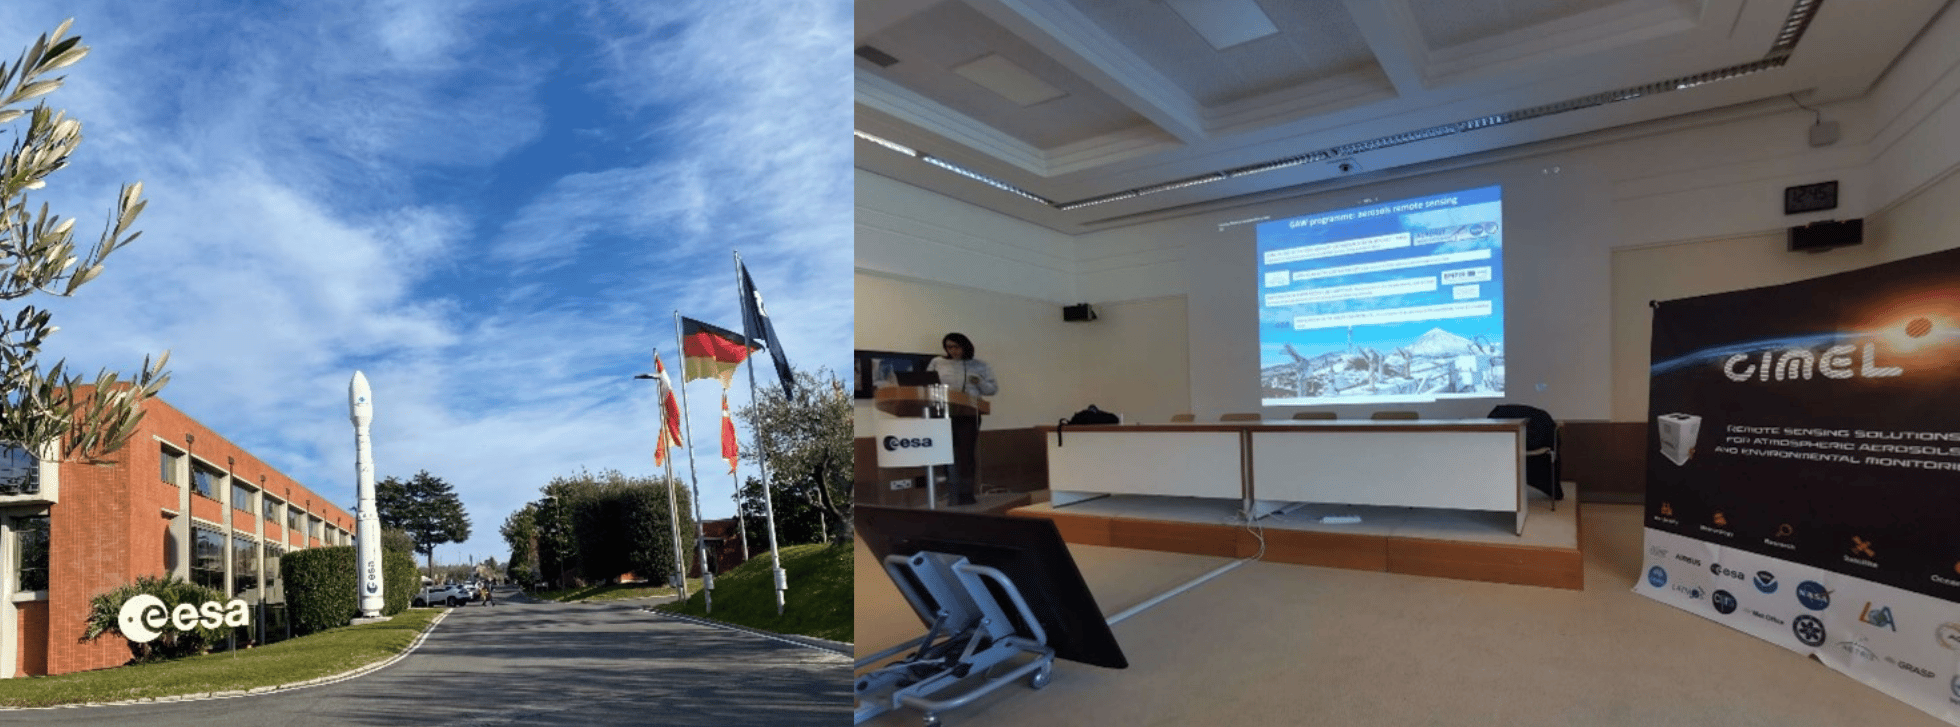
SOlar Radiation Based Established Techniques for aTmospheric Observations (SORBETTO) Winter school took place from February 6th to 10th atESA-ESRIN(European Space Research Institute), in Frascati, Italy and was organized in collaboration with Sapienza University(Roma) and CNR-ISAC (National Research Council – Institute of Atmospheric Sciences and Climate).
SORBETTO is an important training event for young researchers collaborating within the international aerosol’s scientific community (gas and aerosol observations for climatological, meteorological, local and global air pollution studies, remote sensing and in-situ measurements, calibration of satellite measurements…).
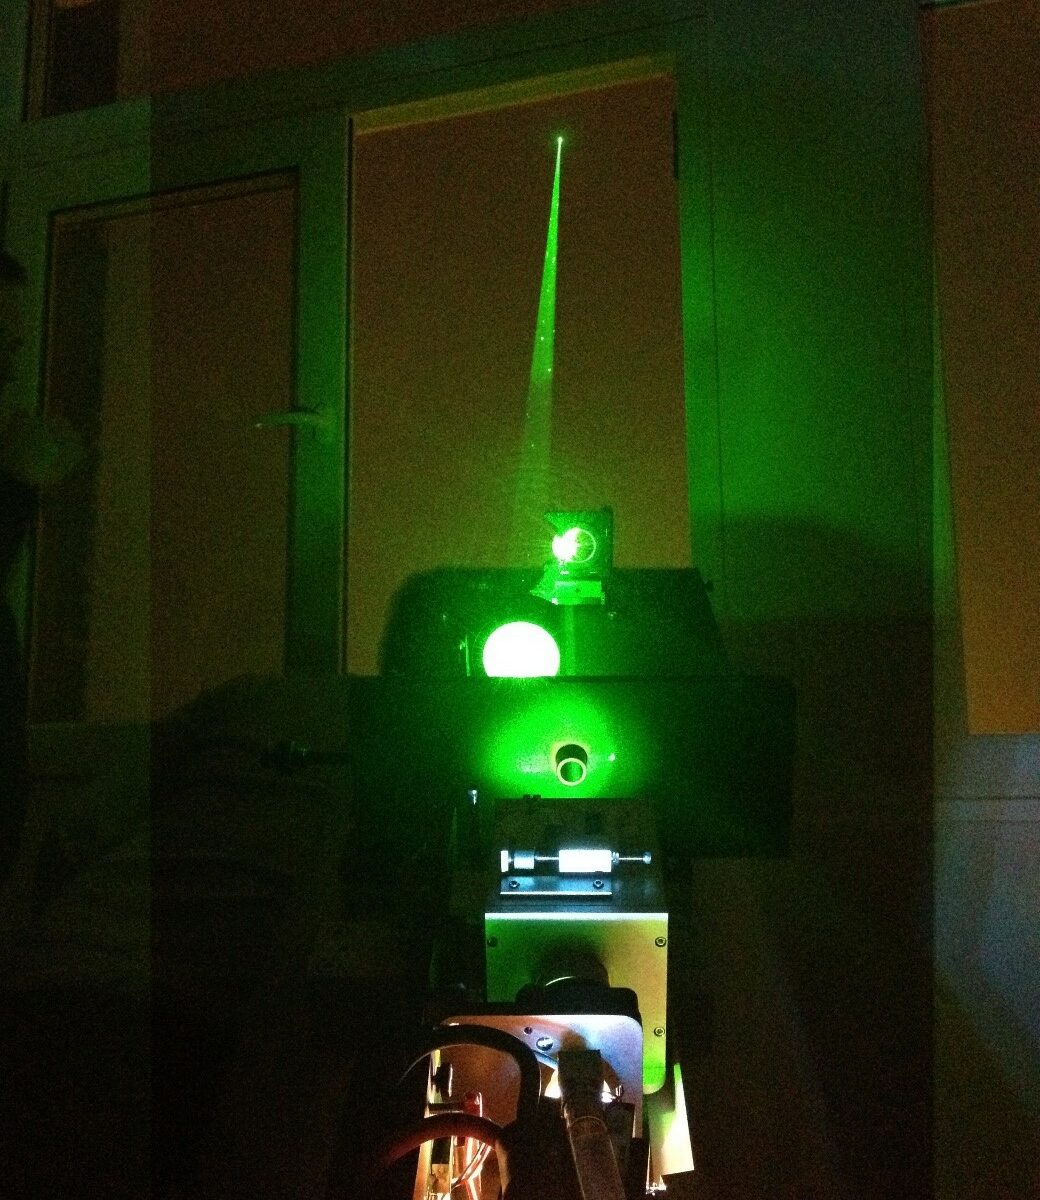
Ground-based instruments deployed in Networks such as AERONET are key players to perform high quality observations that contribute to the Validation and Calibration (CAL/VAL) of satellite missions. Instruments such as Sun Sky Lunar Photometers or LiDARs allow to check that information derived from satellite sensors is comparable to ground measurements and thus, to validate their accuracy.
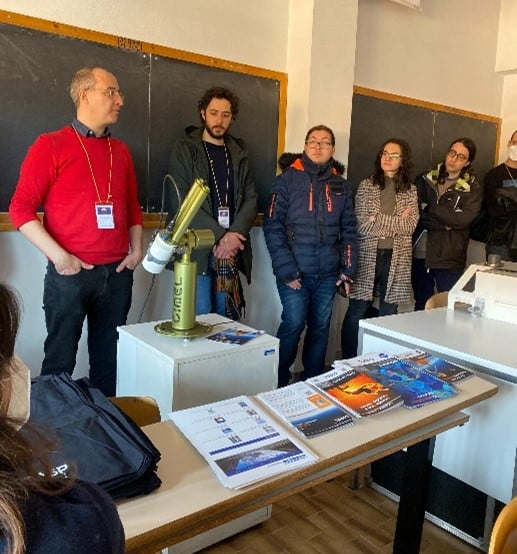
CIMEL Team operating an instrumental demonstration of CE318-T Sun Sky Lunar Photometer at University of Sapienza, 9th 2023.
The instrument show held on Thursday 9th at Sapienza University was the opportunity for students to attend a presentation of various solutions such as CIMEL CE318-T Sun Sky Lunar Photometer, exclusive instrument of NASA Aerosol Network AERONET.
It was a pleasure for CIMEL to attend the event with our great and exclusive Italian Business Partner XEarPro Srl. With 20 years of experience in the field of environmental monitoring, XEarpro Srl contributes in the development of applications and solutions to safeguard the environment around us. We collaborate closely to meet the needs of the Italian scientific community in term of aerosols remote sensing instruments.
The Laboratoire d’optique atmosphérique (LOA) is a joint research unit of the National Center for Scientific Research (CNRS) of France and the University of Lille – Sciences and Technologies. The LOA studies the different components of the atmosphere, mainly clouds, aerosols and gas. In collaboration with the LOA, CIMEL created a joint research laboratory : AGORA-LAB.
Since 2005, the LOA has started the systematic observation of aerosols by LiDAR and has developed a database and an automated real-time data processing system. Its collaboration with CIMEL allowed the creation of the multi-wavelength LILAS LiDAR which was integrated into the European network EARLINET/ACTRIS in 2015.
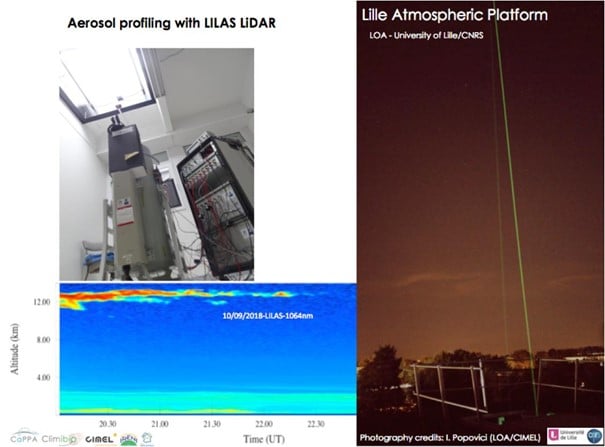
The LILAS LiDAR was specifically designed and adjusted by CIMEL to meet a specific need of the LOA. The transportable multi-wavelength Raman research LiDAR LILAS offers a significant qualitative and quantitative value on aerosol parameters measured at night and during the day, in particular through its combination with CIMEL sun/sky/lunar photometers.
LILAS also allows the observation of clouds and the obtention water vapor and methane profiles. It also gives access to essential climate variables such as the absorption profile of atmospheric aerosols. Its maximum range can reach 20 km and allows it to study the lower stratosphere which can be useful in case of major volcanic eruption for example.
For the Data treatment, the AUSTRAL (AUtomated Server for the TReatment of Atmospheric Lidars) web server data is the processing tool, which provides real-time quicklooks of the LiDAR Range Corrected Signals (RCS) and Volume Depolarization Ratio (VDR) as well as Klett inversion results (extinction and backscatter coefficient profiles).
To answer the need of various stakeholders, the CE710 LiDAR is a fully customizable high power multi-channel aerosols LiDAR resulting from the collaboration between the LOA, CIMEL and Dr. Igor Veselovskii institute. Depending on the requirements and budgets of each, it exists multiple options to customize the LiDAR. For exemple, the choice of the laser type and the wavelengths, the depolarization options or the Raman options (and many more).
Thanks to its precision in the detection of aerosols, the LILAS CE710 LiDAR has highlighted many atmospheric natural events such as volcanic eruptions (ash) or dust and sand events for example but also biomass burning particles coming from fires. LILAS data and all the LiDAR’s activities between the LOA and CIMEL bring a precious monitoring tool to understand atmospheric phenomenas over France, Europe and worldwide.
Figure 1 : View of LILAS (telescope, laser, and acquisition bay) in vertical view, open roof hatch and example of observed aerosol profiles. LILAS is a transportable multi-wavelength Elastic & Raman LiDAR. It has 3 elastic channels (355, 532 and 1064 nm), 3 Raman channels (387, 407 and 530 nm) and 3 depolarized channels (355, 532 and 1064 nm).
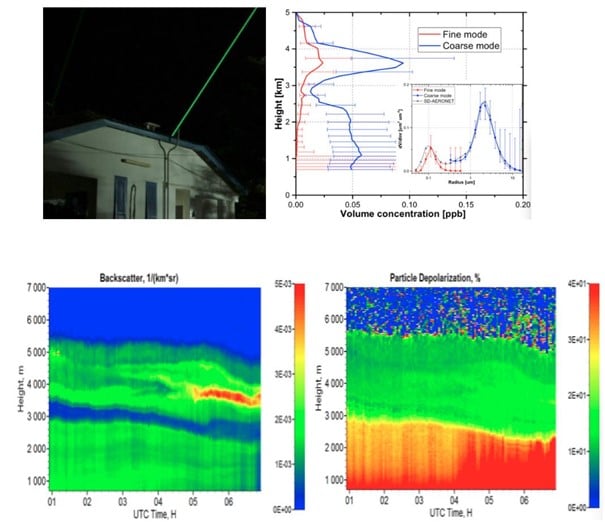
Figure 2: Night time LILAS operation during SHADOW-2 campaign in Senegal (Credits: Q. Hu, LOA)
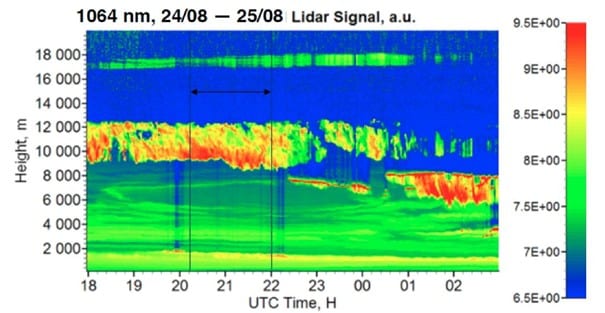
Figure 3 : Detection of smoke particles injected up to 17 km into the stratosphere by intense pyro-convection generated by the Canadian wildfires of summer 2017 (Hu et al., 2018).
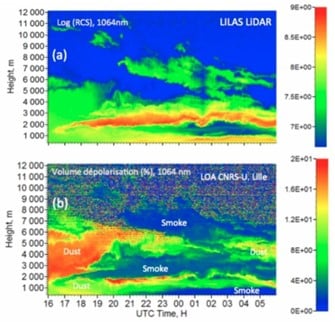
Figure 4: Illustration of the extreme event in October 2017. LiDAR LILAS time series from 16/10/17-16:00 to 17/10/17-06:00 UTC at the Lille site (LOA). (a) The reddest regions indicate a high concentration of particles while the blue regions indicate a very low concentration of particles. (b) Aerosol depolarization which informs us about the shape of the particles and thus their nature, desert or fire particles. Graphic credits Q. Hu, LOA
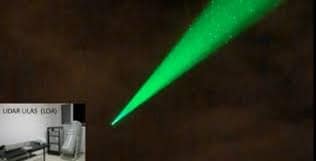
Figure 5: LiDAR LILAS LOA
Communications and posters
Podvin T., P. Goloub, D. Tanré, I. Veselovskii, V. Bovchaliuk, M. Korensky, A. Mortier, S. Victori, .LILAS, un LIDAR multispectral et Raman pour l’étude des aérosols, de la vapeur d’eau et des nuages, Atelier Experimentation et Instrumentation 2014 (oral presentation)
Podvin T, Q. Hu, P. Goloub, O. Dubovik, I. Veselovskii, V. Bovchaliuk, A. Lopatin, B. Torres, D. Tanré, C. Deroo, T. Lapyonok, F. Ducos, A. Diallo. , LILAS, le Lidar multi spectral Raman polarisé et quelques résultats d’inversions, Atelier Experimentation et Instrumentation 2017 (poster presentation).
Hu et al., Aerosol absorption measurements and retrievals in SHADOW2 campaign, ICAC 2017, International Conference on Aerosol Cycle, 21 – 23 Mar, Lille
Hu et al., A test of new approaches to retrieve aerosol properties from Photometer-LiDAR joint measurements, ESA/IDEAS Workshop 2017, Lille, 06-07 Apr 2017
Hu et al., Retrieval of aerosol properties with Sun/Sky-photometer and LiDAR measurements, ACTRIS-FR, Workshop, Autrans Méaudre en Vercors, 3-5 mai 2017
Hu et al., Retrieval of aerosol properties with Sun/Sky-photometer and LiDAR measurements, 28th ILRC, international LiDAR and Radar conference, Bucharest, 25 – 30 June
Hu et al., Lidar measurements with 3-depolarization in Lille, 3rd ACTRIS-2 WP2 Workshop, Delft, 13-17 Nov 2017.
Podvin. T, Q. Hu, P. Goloub, I. Veselovskii, C. Deroo, G. Dubois, T. Trivellato, I. Popovici, B. Torres. Aerosol Remote Sensing at Lille observation platform: upgrade of profiling capabilities. ACTRIS-2 / WP2 Aerosol Profiling – Hatfield – 19-23 November 2018, United Kingdom (présentation poster) http://www-loa.univ-lille1.fr/documents/LOA/posters/20181115_poster_LILAS_WP2_2018.pdf
Qiaoyun Hu, Juan-Antonio Bravo Aranda, Ioana Popovici, Philippe Goloub, Thierry Podvin, Igor Veselovskii, Martial Haeffelin, Christophe Pietras, Transported smoke layers detected over northern France, EGU, 2018 (présentation poster) http://www-loa.univ-lille1.fr/documents/LOA/posters/2018_EGU_Hu.pdf
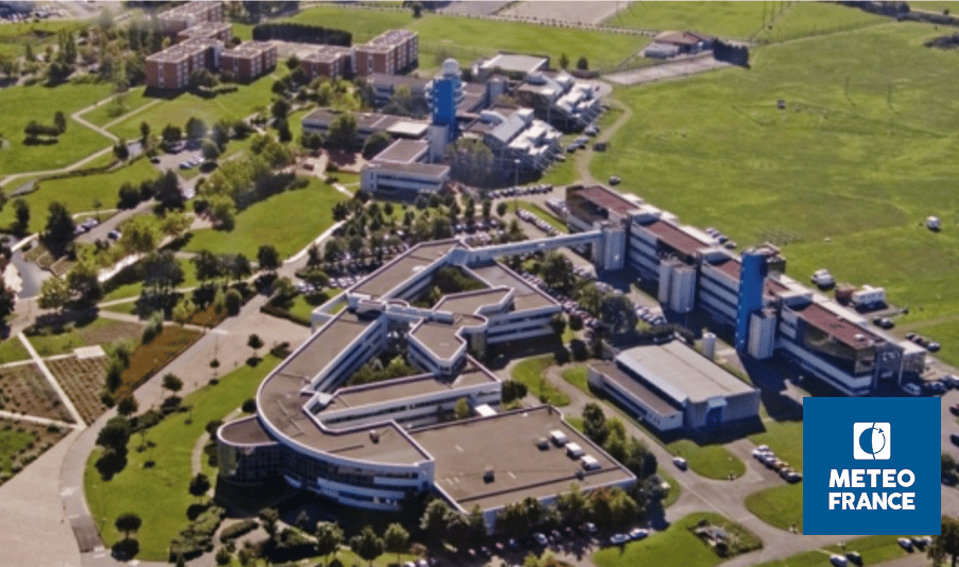
Météo-France is a public administrative institution, the official meteorological and climatological service in France. As such, it exercises the State’s responsibilities in terms of meteorological safety. The institution is also in charge of managing and modernizing an observation network of the atmosphere, the surface ocean and the snow cover in France and overseas.
The institution is also present on an international level as it contributes to the programs and activities of the World Meteorological Organization (WMO) which sets standards that meet the shared needs of its Member States.
Météo-France’s research department, the Centre national de recherches météorologiques (CNRM), is a joint research unit with the CNRS. Météo-France is also a joint supervisor of the Laboratoire de l’Atmosphère et des CYclones (LaCy), the Service des Avions Français Instrumentés pour la Recherche et l’Environnement (SAFIRE), and the Observatoire Midi-Pyrénées (OMP).
Météo-France core missions are linked to the needs related to the protection of people and property: weather forecasting, knowledge of the climate and its evolution, physics and dynamics of the atmosphere and interactions between men, the climate and the atmosphere…
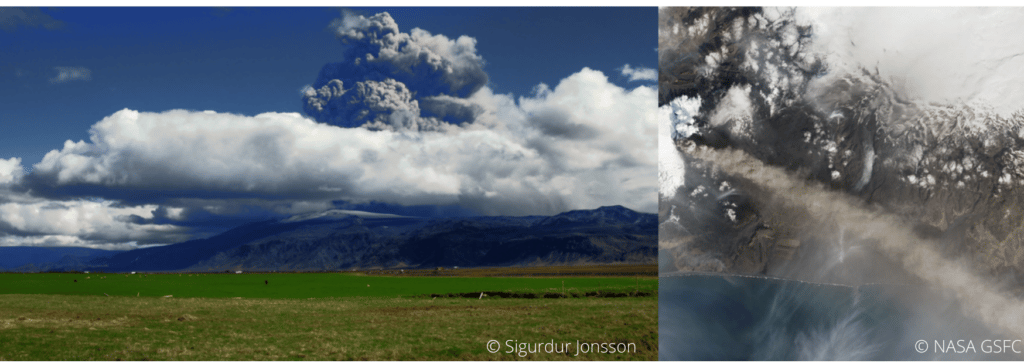
The knowledge of weather conditions is of huge importance for the aviation industry for example. Landing, taking off and even flying safely depends on weather conditions. The perfect example of this huge importance is the eruption of the volcano Eyjafjallajökull which occurred in April 2010. The Icelandic volcano released a thick ash of smoke which disrupted European air traffic, causing five days of complete interruption of traffic: the largest closure of airspace decreed in Europe, not without financial consequences as it led to considerable losses.
Indeed, volcanic ash which tends to settle in the atmosphere is dangerous as it can be sucked into the plane’s engines, then, melt, and finally clog the jet engines. It can cause air plane accidents.
Hence the importance of using state-of-the-art remote sensing measuring instruments to determine for instance the localization, the characterization and the concentration of aerosols in the atmosphere. For this purpose, Météo-France works in collaboration with the LOA (Laboratoire d’Optique Atmosphérique) to manage and maintain a network of efficient solutions and link several instruments such as LiDARs and CIMEL photometers (ready-to-use by AERONET) for more accurate data and considerably reduced uncertainties.
To this end, CIMEL works in close collaboration with Météo-France and ensures to provide quality and constantly improved instruments to meet the urgent needs in terms of security.
Actually, CIMEL also provides instrument synergies between Photometers and LiDARs through a unique monitoring software iAAMS, dedicated to the aerosols study and analysis. The obtained parameters are the characterization of aerosol types, the extinction and backscatter profile of mass concentration. Cimel’s AAMS is able to automatically locate, identify and quantify aerosols, layer by layer, day and night.
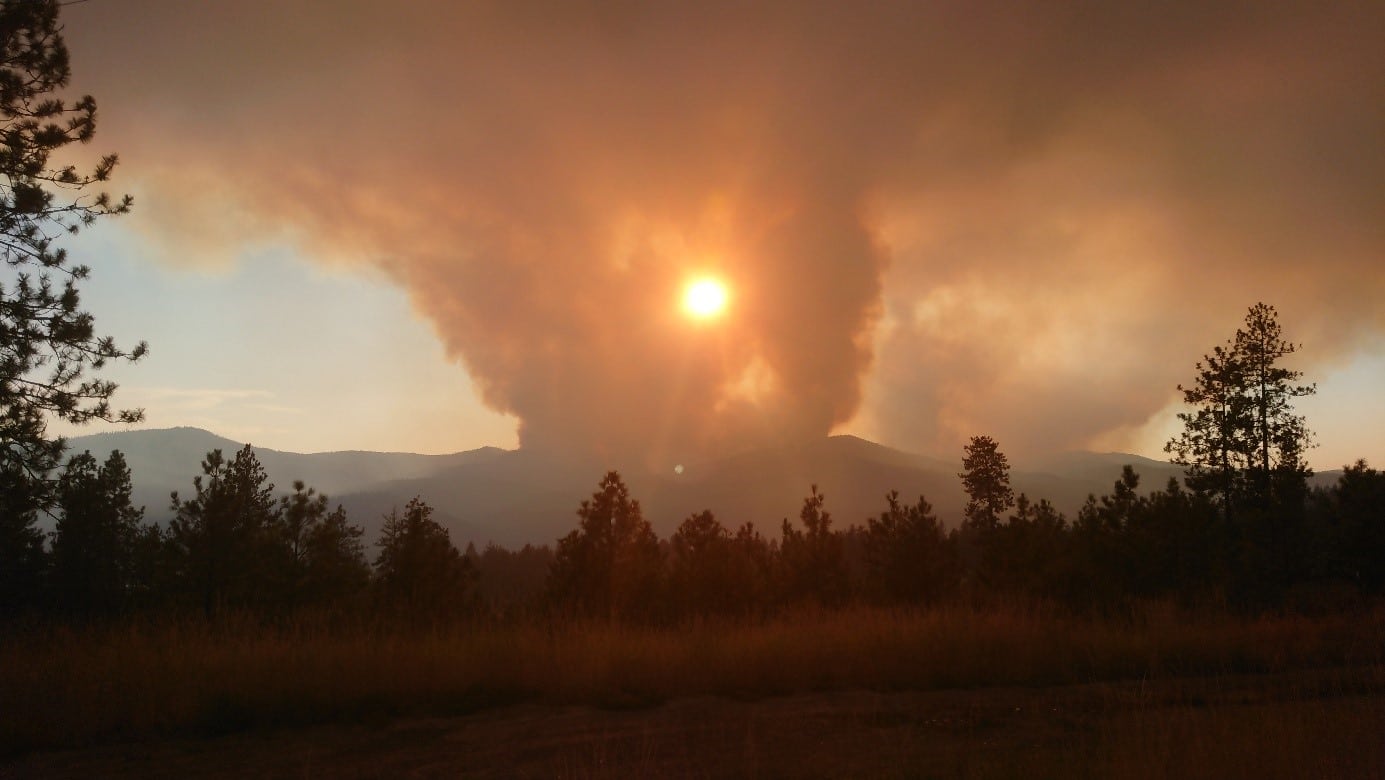
US west coast forests are more and more in the grip of Wildfires.
Keywords : Aerosols, LiDARs, MicroLiDARs, Monitoring, Earth observation, Remote sensing, Wildfire, Smoke, Ash, Fires, Climate Change, Global Warming, Atmospheric Monitoring, Mobile Solutions, Air Quality
June 28th 2022
According to a recent UN report, forest fires will continue to increase by the end of the century. It is especially the case on the west coast of the United States, which is one of the countries most affected by this phenomenon. Whether they are natural or human-caused, these fires are devastating on a large scale.
The global warming makes the conditions more favorable to the start of fires and their proliferation. The climate change is worsening the impacts by prolonging the fire seasons.
California is the most wildfire-prone state in the United States. In 2021, over 9000 wildfires burned in the Southwestern state ravishing nearly 2.23 million acres.
Fires are a danger to life on the planet: smoke inhalation, soil degradation and water pollution, destruction of the habitats of many species… Not to mention the aggravation of global warming due to the destruction of forests, crucial to absorb the carbon that we emit.
Therefore, on summer 2019, NASA initiated FIREX-AQ mission so as to investigate on fire and smoke from wildfire using several measurement instruments across the world, and especially in the US.
NASA uses satellites combined with airborne and ground-based instruments to decipher the impact of wildfires.
The emissions of ash clouds resulting from the fire can be transported thousands of miles and can have an impact on air quality for example as they are responsible for a large fraction of the US PM2.5 emissions. Due to its microscopic size, PM2.5 is easily inhaled and has the potential to travel deep into our respiratory tracts, it can also remain airborne for long periods.
To date, wildfire outputs are still poorly represented in emission inventories.
The overarching objectives of FIREX-AQ are to:
Provide measurements of trace gas and aerosol emissions for wildfires and prescribed fires in great detail
Relate them to fuel and fire conditions at the point of emission
Characterize the conditions relating to plume rise
Follow plumes downwind to understand chemical transformation and air quality impacts
Assess the efficacy of satellite detections for estimating the emissions from sampled fires
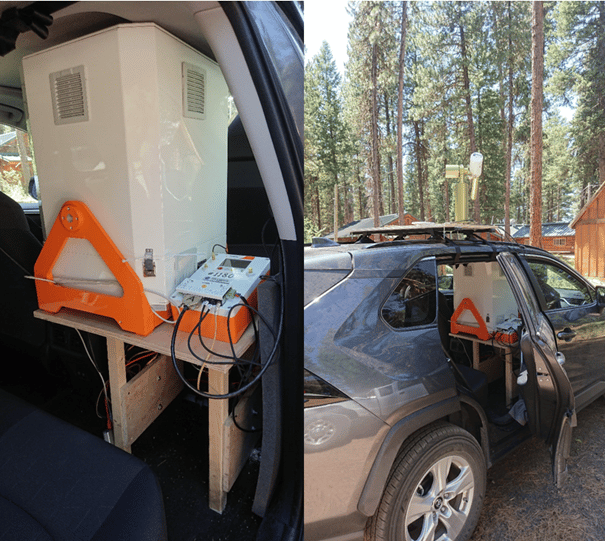
For this purpose, CIMEL provided CE376 micro-LiDARs as well as its network of CE318-T photometers through AERONET. These solutions allowed detailed measurements of aerosols emitted from wildfires and agricultural fires to address science topics and evaluate impacts on local and regional air quality, and how satellite data can be used to estimate emissions more accurately.
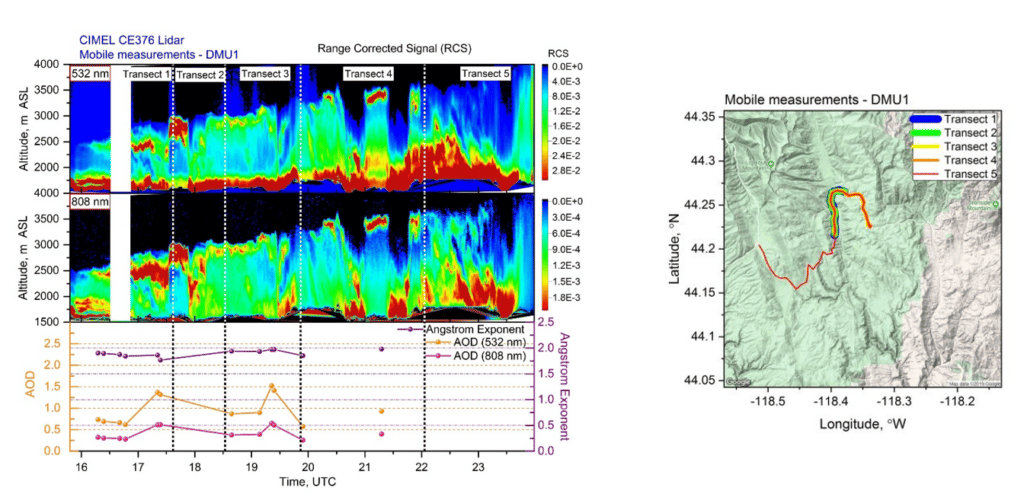
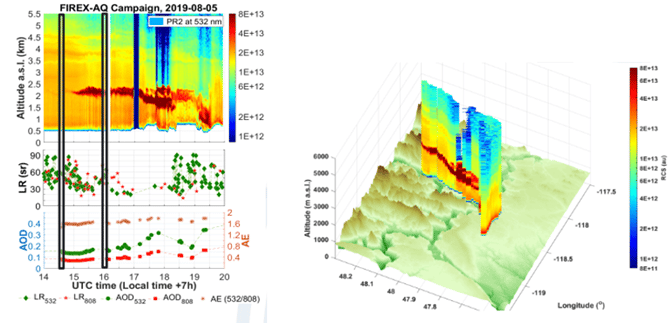
Indeed, the synergy of the photometer with the mobile CE376 LiDAR allows profiling the extinction at 2 wavelengths (532, 808 nm) and of the Angstrom Exponent (AE). AE vertical profile and the depolarization capabilities of the CE376 allow identifying the aerosol type (fine/coarse). Below are some results from the FIREX-AQ 2019 mission:
Figure 2: Mapping of smoke vertical and spatial dispersion thanks to mobile LIDAR and photometer measurements by Dr. Ioana POPOVICI.
Figure 3: Mapping and modelization from FIREX-AQ campaign in Western US (2019) by LiDAR CE376.
FIREX-AQ experience proved that we are able to embark compact remote sensing instruments and install them quickly on site to access harsh environments and get close to fire sources, which has not been done before. Actually, it is the first time a LIDAR reaches that close to fire sources in a mountainous region.
Giles, D. M. and Holben, B. and Eck, T. F. and Slutsker, I. and LaRosa, A. D. and Sorokin, M. G. and Smirnov, A. and Sinyuk, A. and Schafer, J. and Kraft, J. and Scully, A. and Goloub, P. and Podvin, T. and Blarel, L. and Proniewski, L. and Popovici, I. and Dubois, G. and Lapionak, A., (2020), Ground-based Remote Sensing of the Williams Flats Fire Using Mobile AERONET DRAGON Measurements and Retrievals during FIREX-AQ, 2020, AGU Fall Meeting Abstracts.
The Canadian Arctic is probably one of the best areas to conduct climatological studies, especially on global warming given the purity of the atmosphere in this zone, especially due to the absence of anthropological pollution.
Nevertheless, this rather hostile land, due to its temperatures, can make the difficulties of recording measurements very real. Consequently, there is a lack of measurements in the Arctic, hence the need to install platforms with robust and reliable measuring instruments.
Some of those platforms, especially PEARL and OPAL, have a particular emphasis on the Arctic because Canada has a significant portion of its territory in the Arctic.
The Polar Environmental Atmospheric Research Lab (PEARL) and the zerO altitude Polar Atmosphere Laboratory (OPAL) which is part of PEARL, is operated by the CAnadian Network for the Detection of Atmospheric Change (CANDAC) which is a member of AEROCAN. Formed in 2005, PEARL constitutes a network of universities and government researchers dedicated to studying the changing atmosphere over Canada.
The first task of PEARL was to renew and operate the existing laboratory at Eureka in Nunavut, which was created to contribute to the world-wide effort to intensively study the Arctic region through AEROCAN.
The AEROCAN photometer network is run as a joint collaboration between the Université de Sherbrooke and the Meteorological Service of Canada (MSC). It is a full-fledged sub-network of the much larger AERONET network of Cimel photometers and benefits from all the services that AERONET offers.
Objectives:
Understanding atmospheric change over Canada
Integration of measurements taken from space, aircraft, balloons and the ground
Provision of quality-controlled research datasets to researchers
Linkage with international networks for data exchange and supranational planning
In addition, PEARL undertakes measurements that are simultaneous with those made by various satellite instruments. These “validation” measurements are extremely effective because of the location of PEARL and OPAL, and they further enhance the science return of the research as they use state-of-the-art technology solutions like theCE318-T Photometer.
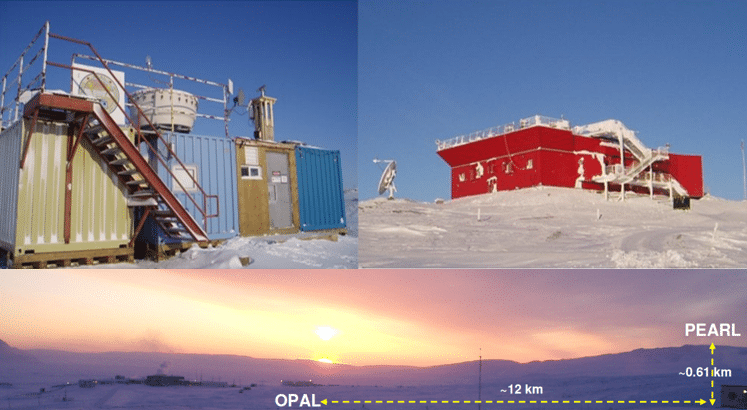
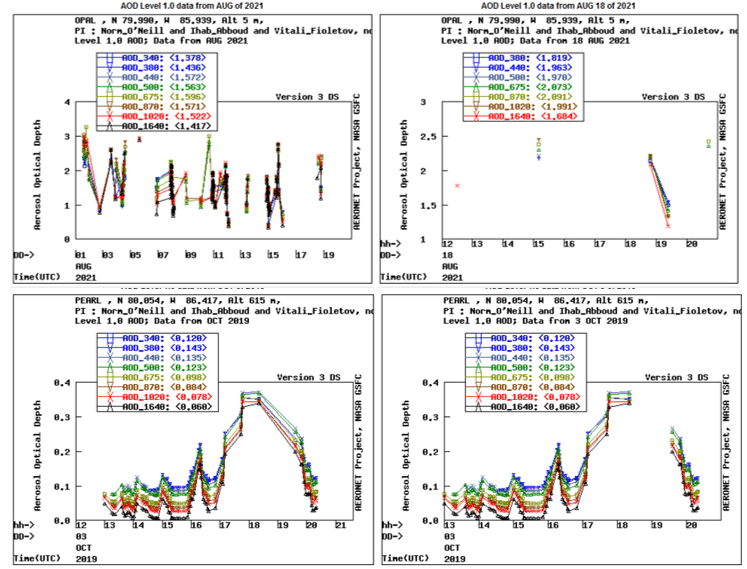
PEARL is located at Eureka, Nunavut (80N, 86W) on Ellesmere Island in Canada’s high Arctic, 450 km north of Grise Fiord, the most northerly permanent settlement. This photometer site is 1,100 km from the North Pole. OPAL is located about 12 km southeast of the PEARL ridge lab which is at an elevation of 610 m. This dual placement was designed to study the layer between the two sites as well as provide an element of redundancy for the AOD measurements.
Figure 1: Location of PEARL and OPAL photometer sites (upper pictures : 2007 CANDAC/Ovidiu Pancrati, bottom picture: Norm O-Neill, Université de Sherbrooke)
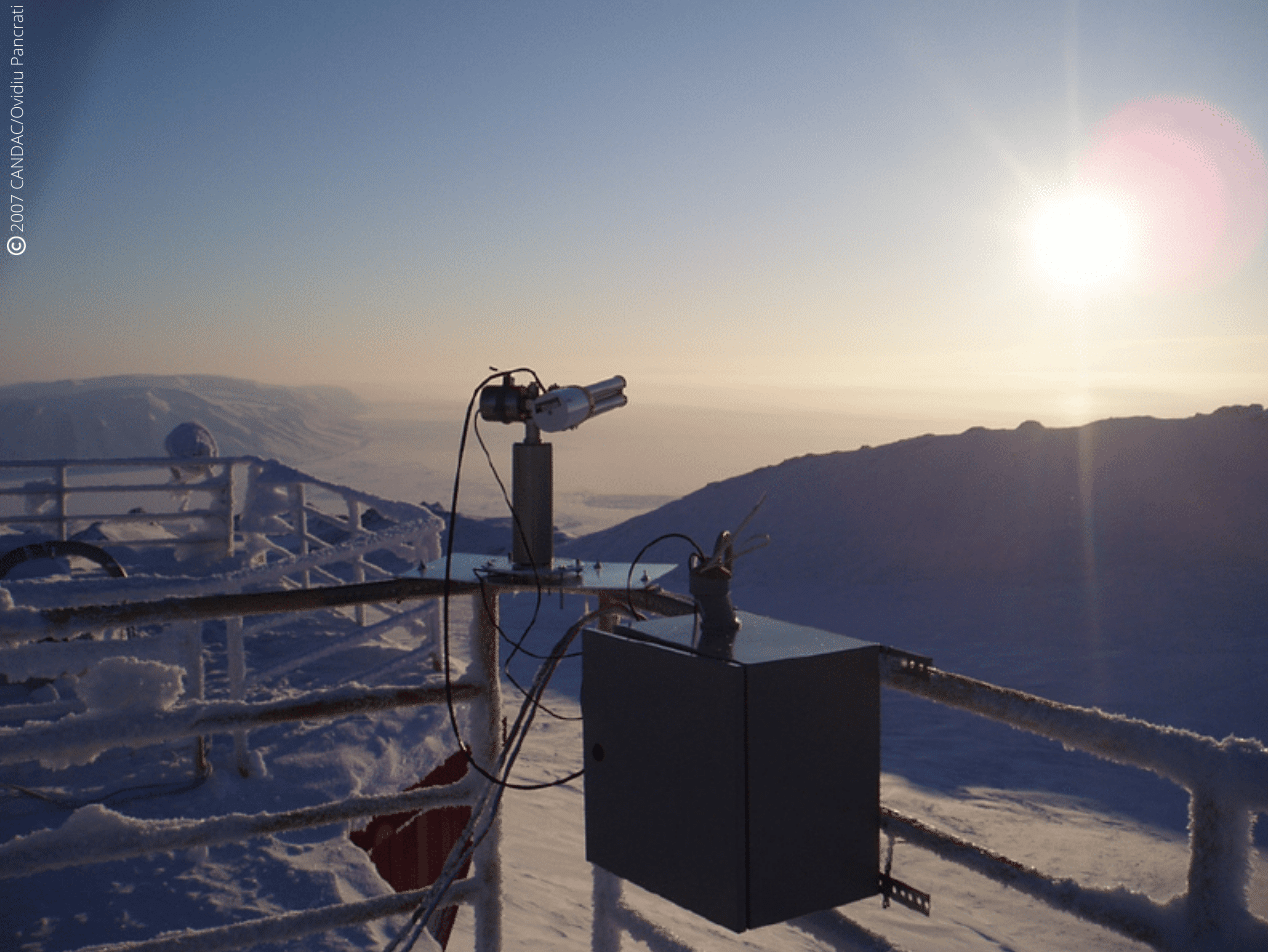
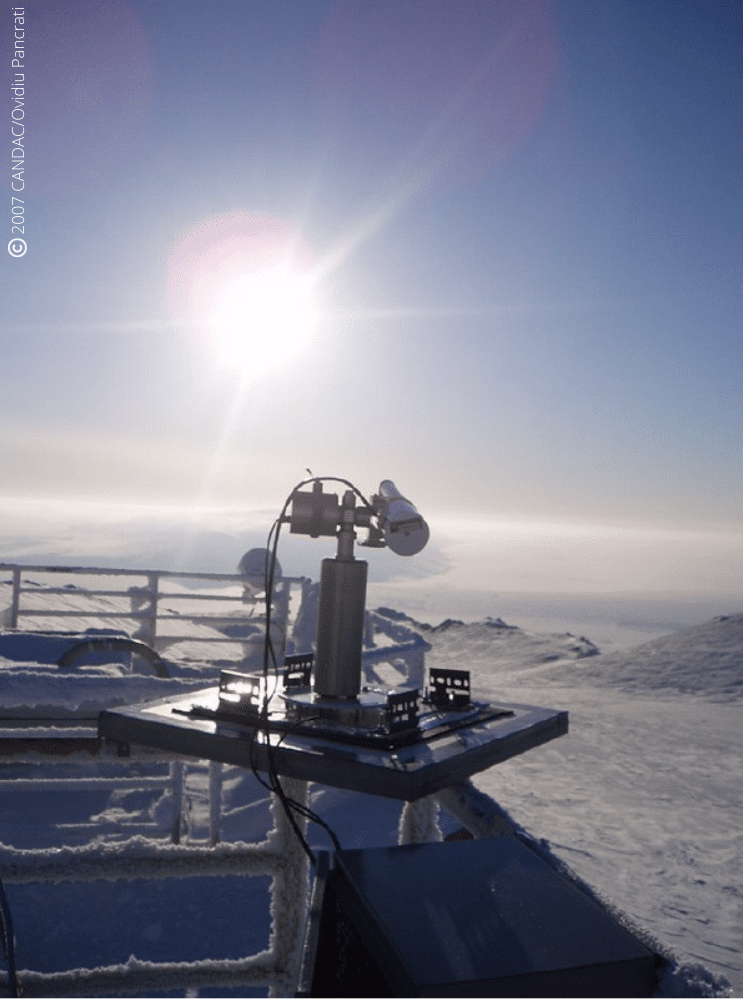
Figure 2: PEARL CE318 Photometer pointing to the sun for a measurement scenario
Figure 3: Latest measurements from Opal (above) and Pearl (bottom) photometers depicting AOD (Aerosol Optical Depth). Credits: NASA AERONET: https://aeronet.gsfc.nasa.gov/
Results:
A multi-year AOD and effective radius climatology for the high Arctic showed a number of consistent features using the Cimel CE318-T Photometer: • Spring to summer decrease of fine-mode AOD (probably attributable to biomass burning and/or anthropogenic pollution) • Significant correlation of fine mode AOD with CO (Carbon monoxide) concentration which indicates a predominance of biomass burning aerosols throughout the entire year • West to East decrease in AOD on a pan-Arctic scale Another study (Antuña-Marrero et al., 2022) has been conducted for water vapor research. It shows that it is feasible to use Cimel CE318-T Photometer AERONET observations in the Arctic for water vapor research, considering the robust quantification of its dry bias that has been established. As a matter of fact, AERONET imposes standardization of instruments, calibration, processing and distribution that Cimel is the exclusive provider. Its IWV (Integrated Water Vapor) observations are an ideal standard dataset to re-calibrate or homogenize the rest of the instrumental IWV observations to a predefined absolute standard dataset.
References:
Antuña-Marrero, Juan Carlos & Román, Roberto & Cachorro, Victoria & Mateos, David & Toledano, Carlos & Calle, Abel & Antuña Sánchez, Juan Carlos & Vaquero-Martínez, Javier & Antón, Manuel & Baraja, Ángel. (2022). Integrated water vapor over the Arctic: Comparison between radiosondes and sun photometer observations. Atmospheric Research. 270. 106059. 10.1016/j.atmosres.2022.106059.
AboEl‐Fetouh, Y., O’Neill, N. T., Ranjbar, K., Hesaraki, S., Abboud, I., & Sobolewski, P. S. (2020). Climatological‐scale analysis of intensive and semi‐intensive aerosol parameters derived from AERONET retrievals over the Arctic. Journal ofGeophysical Research: Atmospheres, 125, e2019JD031569. https://doi.org/10.1029/2019JD031569
Mölders, N. and Friberg, M. (2020) Using MAN and Coastal AERONET Measurements to Assess the Suitability of MODIS C6.1 Aerosol Optical Depth for Monitoring Changes from Increased Arctic Shipping. Open Journal of Air Pollution, 9, 77-104. https://doi.org/10.4236/ojap.2020.94006
Since 2002, more than 31 OC measurement sites have been integrated on the NASA AERONET OCEAN COLOR network through offshore fixed platforms and coastal platforms all around the world. Thanks to numerous collaborations between environmental sciences and energy industries such as discussed below, the number of Ocean Color measurement sites keeps growing.
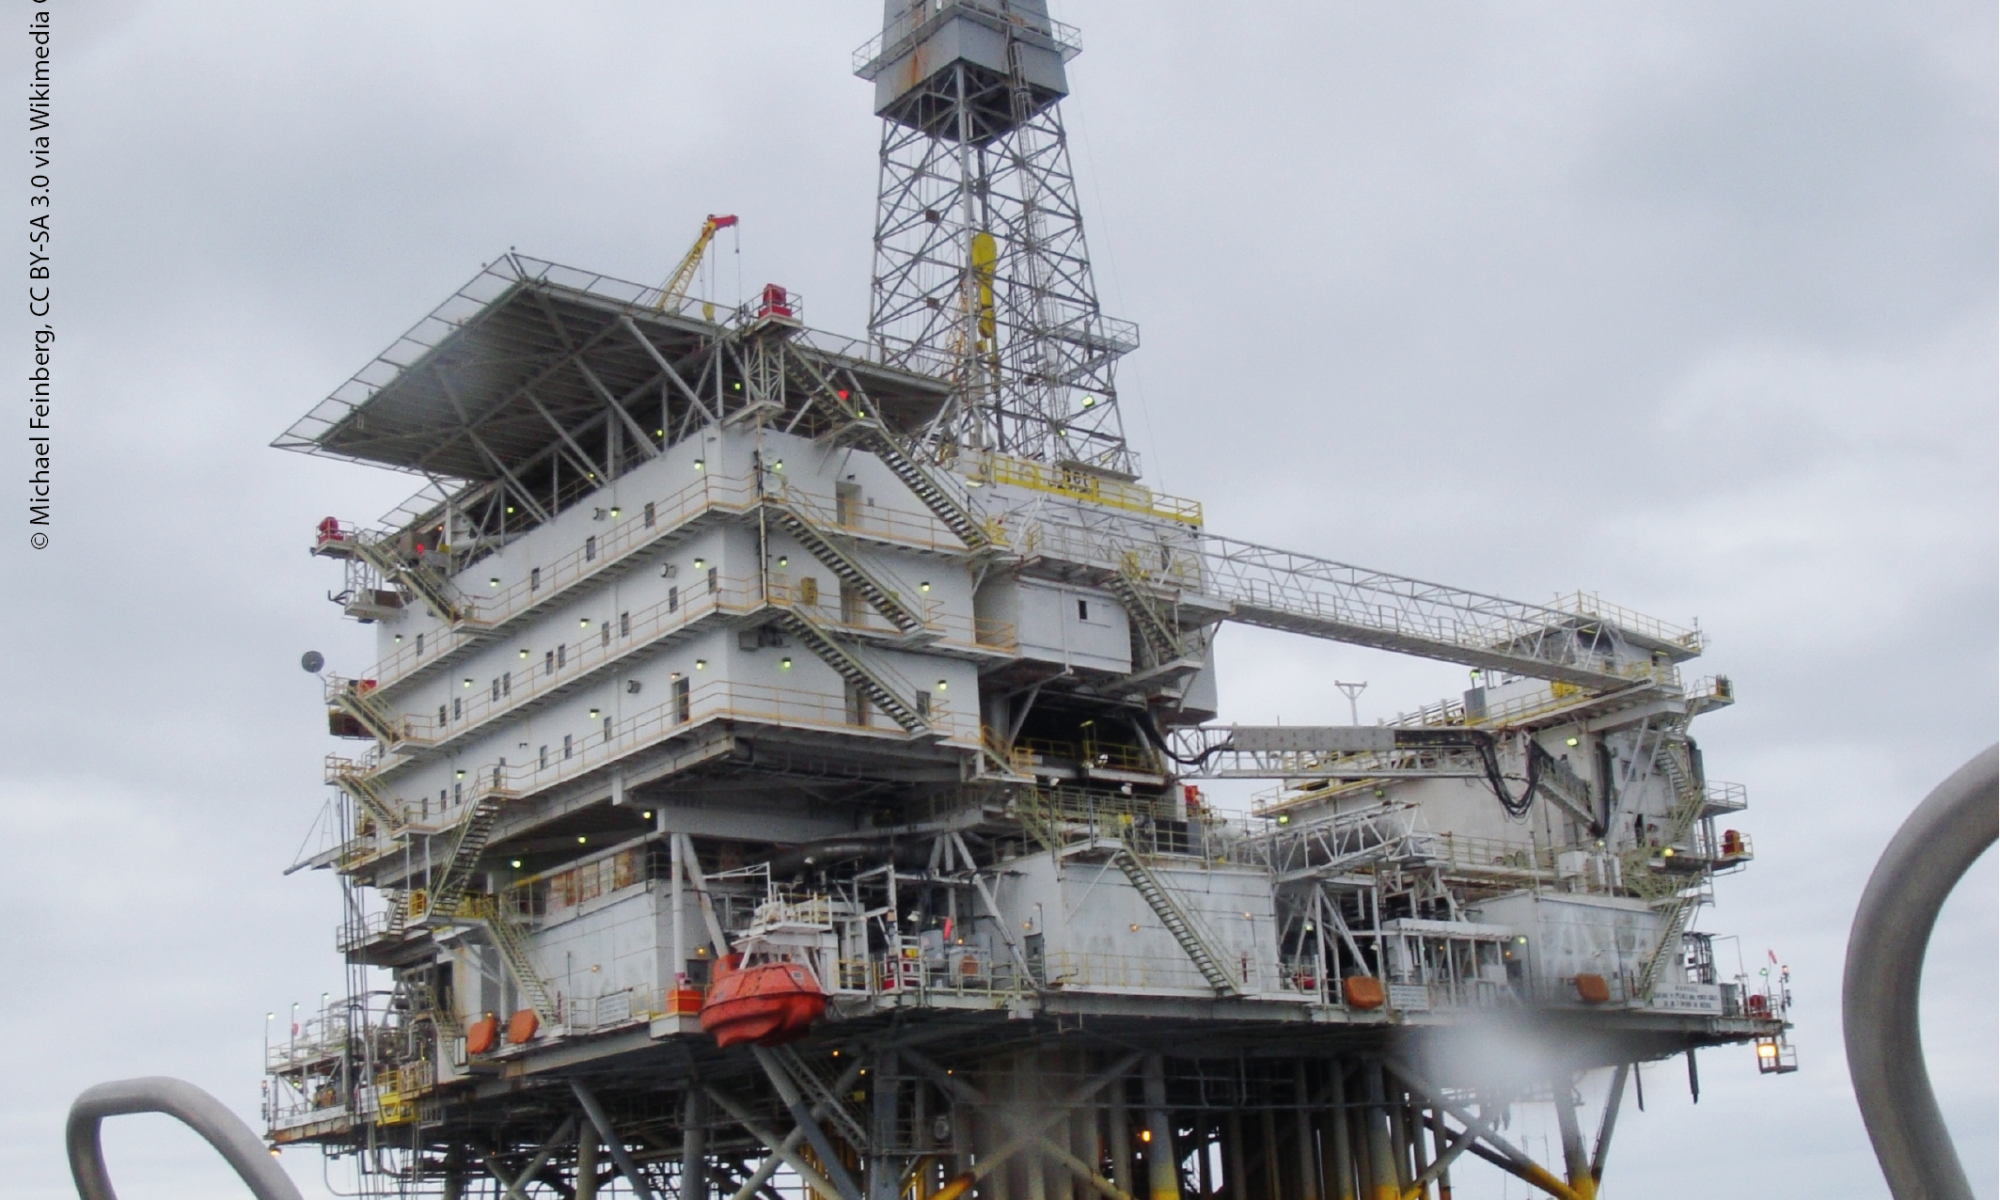
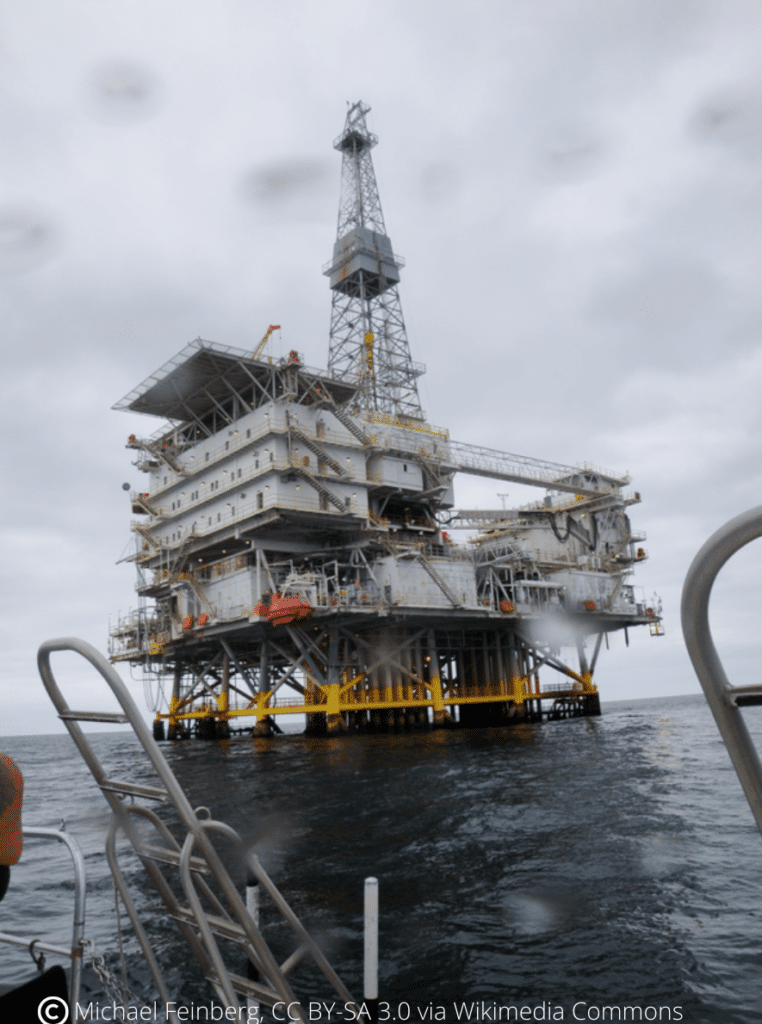
In collaboration with University of Southern California (USC), the SeaPRISM site at the oil rig platform Eureka was installed in the Los Angeles Harbor and was initially operational in April 2011. CE318-TV12-OC (SeaPRISM) photometers are part of the AERONET network of automated instruments designed to make automated measurements of aerosols around the world.
The SeaPRISM instrument has been modified to also view the ocean surface and measure ocean color remote sensing reflectance as well as the aerosol measurements. Data is currently flowing to NASA AERONET as well as NRL-SSC (The Naval Research Laboratory detachment at Stennis Space Center (SSC), Mississippi) and Oregon State University (OSU) for matchups. Data has been collected routinely since June 2012 to date.
Continuity of the ocean color products between ocean color satellites is required for climate studies, as well as to enhance the operational products used in ecological monitoring and forecasting, such as accurately monitoring ocean water quality and determining changes along our coastlines. In addition, inter-satellite product comparisons are essential for data continuity into the future.
The JPSS (Joint Polar Satellite System) calibration and validation team has developed an infrastructure to evaluate VIIRS (Visible Infrared Imaging Radiometer Suite) Ocean Environmental Data Records (EDRs): routinely nLw(λ) and chlorophyll are evaluated against existing satellites data measurements. Ocean color products are based on nLw( λ) from which specific products of chlorophyll, backscattering coefficients, absorption coefficients, and diffuse attenuation coefficients are computed.
Therefore the accurate radiometric retrieval of the nLw( λ) is considered essential for the production of any ocean color product. A web-based with the VIIRS data matching the satellite data from Platform Eureka SeaPRISM was created in order to provide reliable data. The CE-318 of the oil platform Eureka helps to validate the satellite data provided by VIIRS on the JPSS.
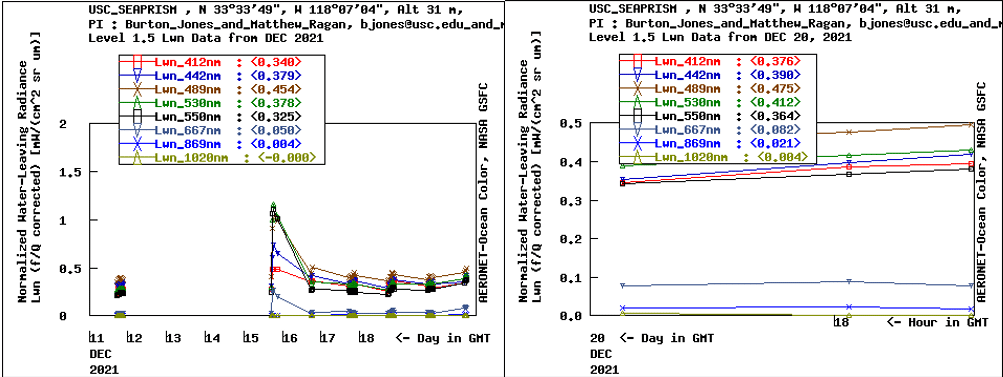
Here are some results performed recently by the CE318-TV12-OC (SeaPRISM)located at Platform Eureka depicting the Normalized Water-Leaving Radiance.
Figure 1: Measurements performed at AERONET-OC Eureka oil platform, California – Normalized Water-Leaving Radiance [Lw]N.
Curtiss O. Davis, Nicholas Tufillaro, Jasmine Nahorniak, Burton Jones, and Robert Arnone “Evaluating VIIRS ocean color products for west coast and Hawaiian waters”, Proc. SPIE 8724, Ocean Sensing and Monitoring V, 87240J (3 June 2013); https://doi.org/10.1117/12.2016177
The implantation of CE318-T photometers on offshore and coastal platforms constitutes a major turning point for atmospheric and ocean color applications.
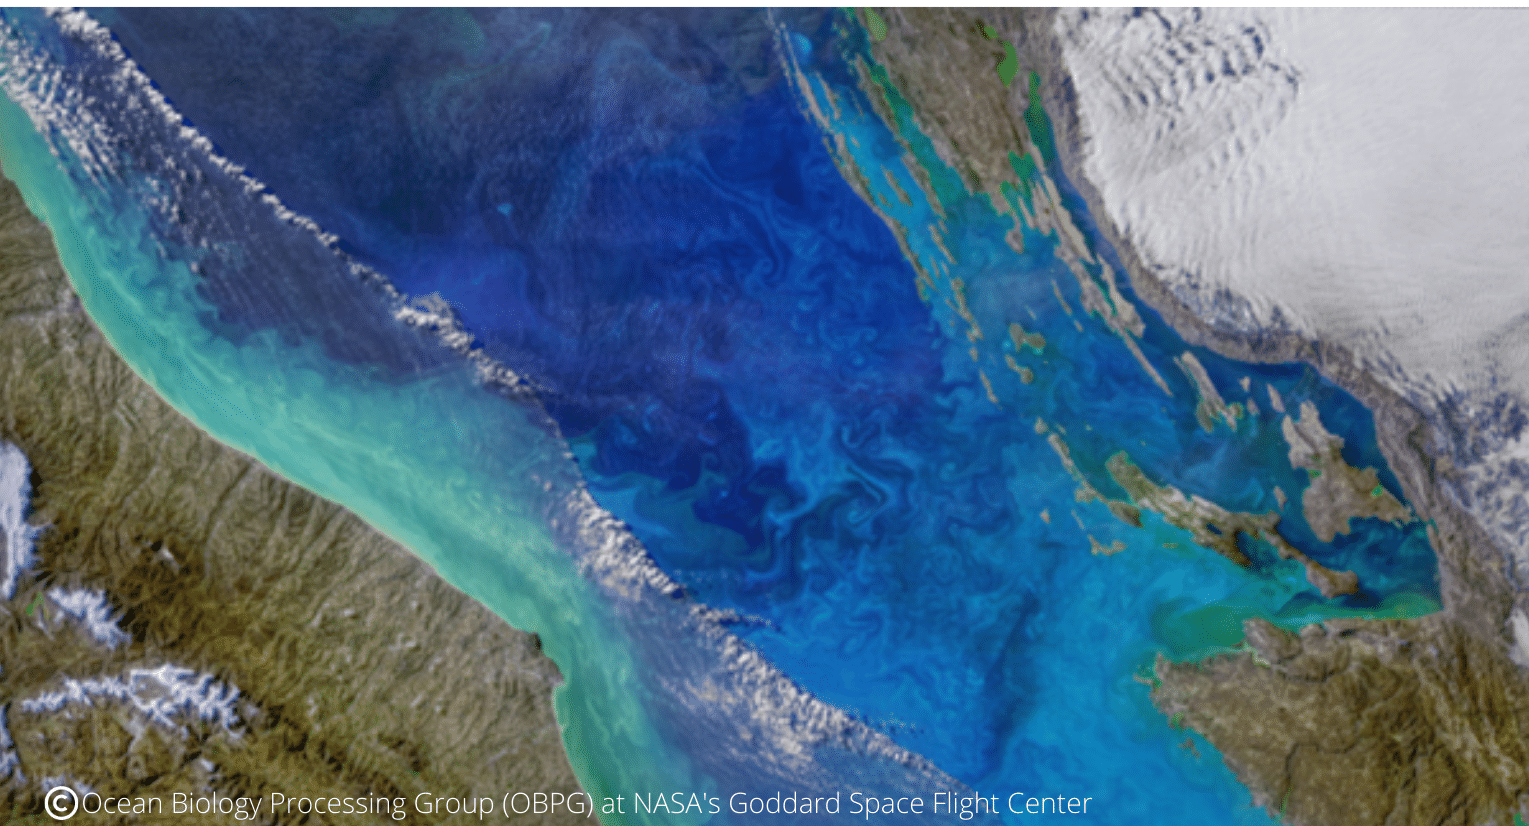
The main substances that affect the color of the ocean include dissolved organic matter, living phytoplankton with chlorophyll pigments, and non-living particles like marine snow and mineral sediments. Ocean color data have a critical role in operational observation systems monitoring coastal eutrophication, harmful algal blooms, and sediment plumes. Scientists rely on satellite observations to monitor Ocean Color (OC) parameters, such as chlorophyll a concentration (Chla) and inherent optical properties of water (IOP), to better understand the role of the ocean in the Earth’s climate.
However, the current satellite measurement systems can provide only coarse spatial resolution, with relevant lack of data.
Thus, AERONET Ocean Color saw the light of day in 2002. This new component of AERONET (NASA AErosol RObotic NETwork) aims at providing more data concerning satellites measurements as there is a lack of insights in the monitoring of marine aerosols and water radiance. Since 2002, more than 31 OC measurement sites have been integrated on the network through offshore fixed platforms and coastal platforms all around the world.
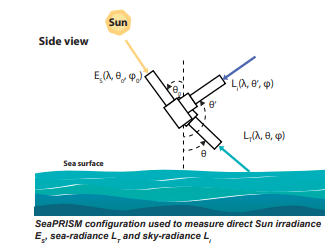
Its particularity is that the measurements are taken from the radiance emerging from the sea using CE318-TV12-OC (SeaPRISM) Cimel photometers. By measuring the water radiance from the sea with instruments installed on coastal/offshore platforms or boats, Cimel improves the accuracy of satellites measurements. AERONET decided in 2015, after full validation, to accept only the CE318-T for new photometers entering the network. Below is a representative drawing of the measurement principle of the CE318-TV12-OC(SeaPRISM) photometer:
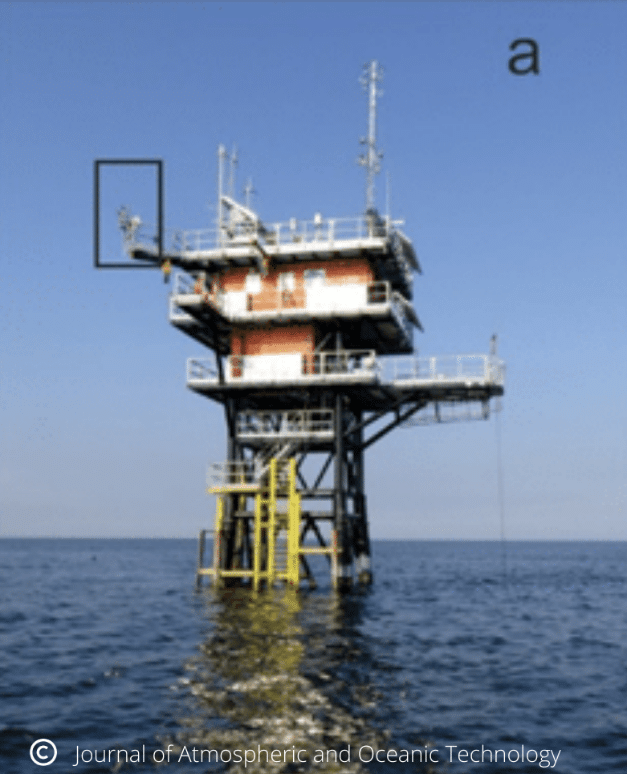
Many missions are conducted by AERONET-OC to collect ocean color data and measurements. Below, one of these campaigns conducted on an offshore platform (AAOT) in the Adriatic Sea.
Figure 2: AERONET OC site located in the Acqua Alta Oceanographic Tower (AAOT) in the Gulf of Venice in the Northern Adriatic Sea in July 2018.
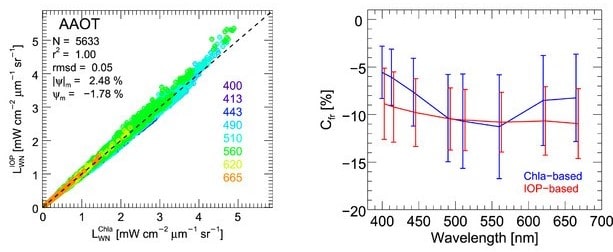
Figure 3: Measurements performed at AERONET-OC AAOT – Scatterplot of LIOP WN(λ) versus LChla WN(λ).
Citation: Zibordi, Giuseppe, Brent N. Holben, Marco Talone, Davide D’Alimonte, Ilya Slutsker, David M. Giles, and Mikhail G. Sorokin. «Advances in the Ocean Color Component of the Aerosol Robotic Network (AERONET-OC)”, Journal of Atmospheric and Oceanic Technology 38, 4 (2021): 725-746, accessed Sep 17, 2021, https://doi.org/10.1175/JTECH-D-20-0085.1
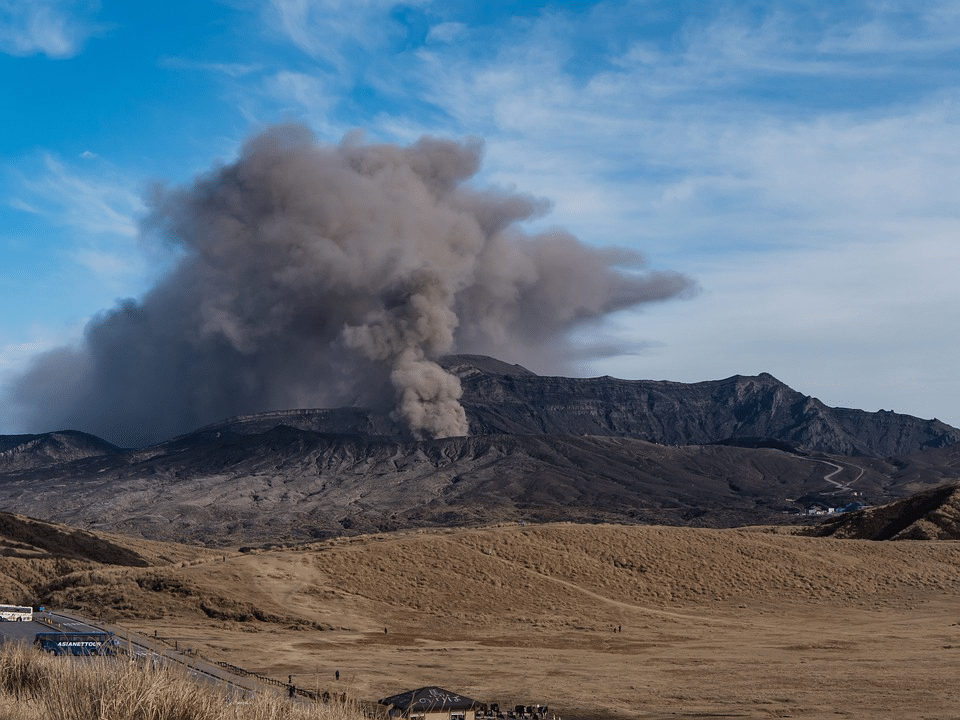
The volcano of Mount Aso located in the south of the Japanese archipelago on the island of Kyushu erupted this Wednesday, October 20, releasing volcanic ashes up to 3,5 kilometers in the atmosphere during the strongest eruption time.
The volcano had not been active since 2016, local authorities are advising residents to remain vigilant of volcanic ashes and gases on the leeward side of the Nakadake crater. As a matter of fact, the gas and projectiles created a cloud that is denser than the surrounding air and which is an extremely hot ash plume due to the turbulence between the flow and the overlying air.
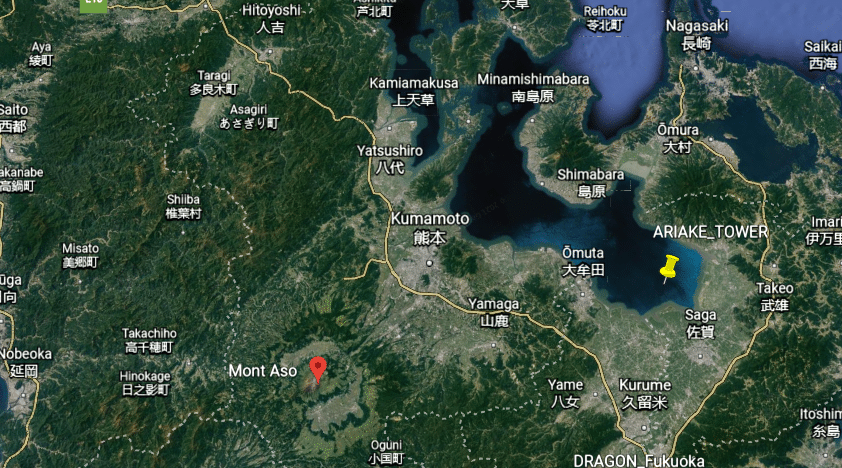
One of the Cimel CE318-T photometer is currently providing atmospheric aerosols measurements near the volcano eruption. Indeed, the NASA AERONET site based on the offshore platform of Ariake observation tower located in Ariake Sea in Japan, is about 5 kilometers from the coast of Saga city in Ariake Sea.
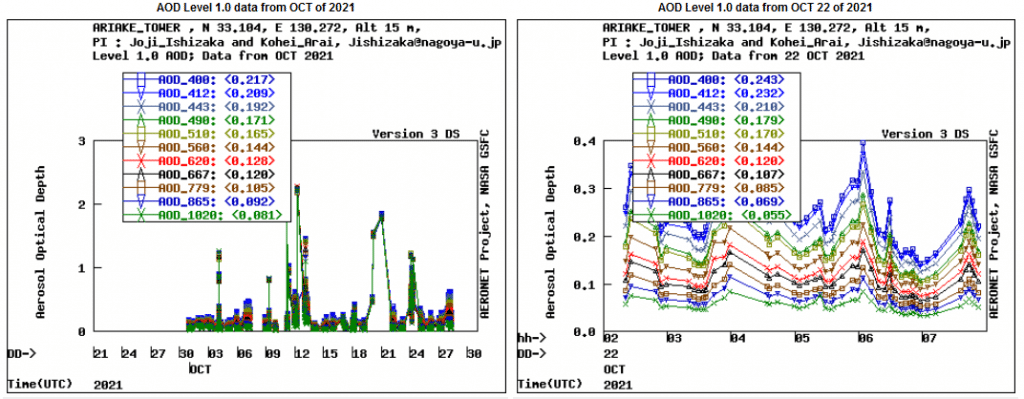
Figure 1: Google Earth satellite image showing the position of the NASA AERONET Ariake Tower site in relation to the Mount Aso volcano in Kyushu Island (Japan). Figure 2: Data provided by the Cimel photometer in the Ariake Toweroperated by Saga University, depicting Aerosols Optical Depth in the atmosphere.
We have collected data recorded by the Cimel CE318 photometer which measures the Aerosols Optical Depth (AOD) in the atmosphere. We note a peak of the AOD on October 21, a day after the volcanic eruption.
With the addition of Cimel CE376 LiDAR, it would be possible to obtain more high added value parameters such as the characterization, location and the extinction and backscatter profile of mass concentration of this kind of ash aerosols in the atmosphere.
See more on our AAMS solution which consists in the synergy between our LiDARs and our photometers.
La Palma eruption (Canary Islands) – volcanic plumes tracking by our LiDARs
Keywords : LiDARs, Aerosols, Atmosphere, La Palma, Cumbre Vieja volcano, CE376.
6th October 2021
The Cumbre Vieja volcano on La Palma in the Canary Islands erupted on 19th September for the first time since 1971 resulting in large lava flows and evacuations.
Due to the volcanic eruption, nearly 10 000 tons of sulfur dioxide are released in the atmosphere every day. The risks generated are acid rain and deterioration of air quality which can lead to respiratory problems.
In a few words, this phenomenon is due to the fact that the lava of the volcano which reaches 1000°C meets the sea water which is at around 20°C. Therefore, the sodium chloride contained in the sea breaks down the water into oxygen and hydrogen. However, when hydrogen meets chlorine, they turn into hydrochloric acid which is an extremely dangerous gas.
There are many consequences such as the impact on the air quality which directly concerns the surrounding populations who breathe a toxic smoke harmful for their health.
Air traffic is also strongly impacted as all the flights departing from the island have been cancelled. These disturbances are also due to the lack of instruments measuring aerosols (such as LiDARs) to accurately identify the location of the volcanic ash as well as its characteristics and concentration.
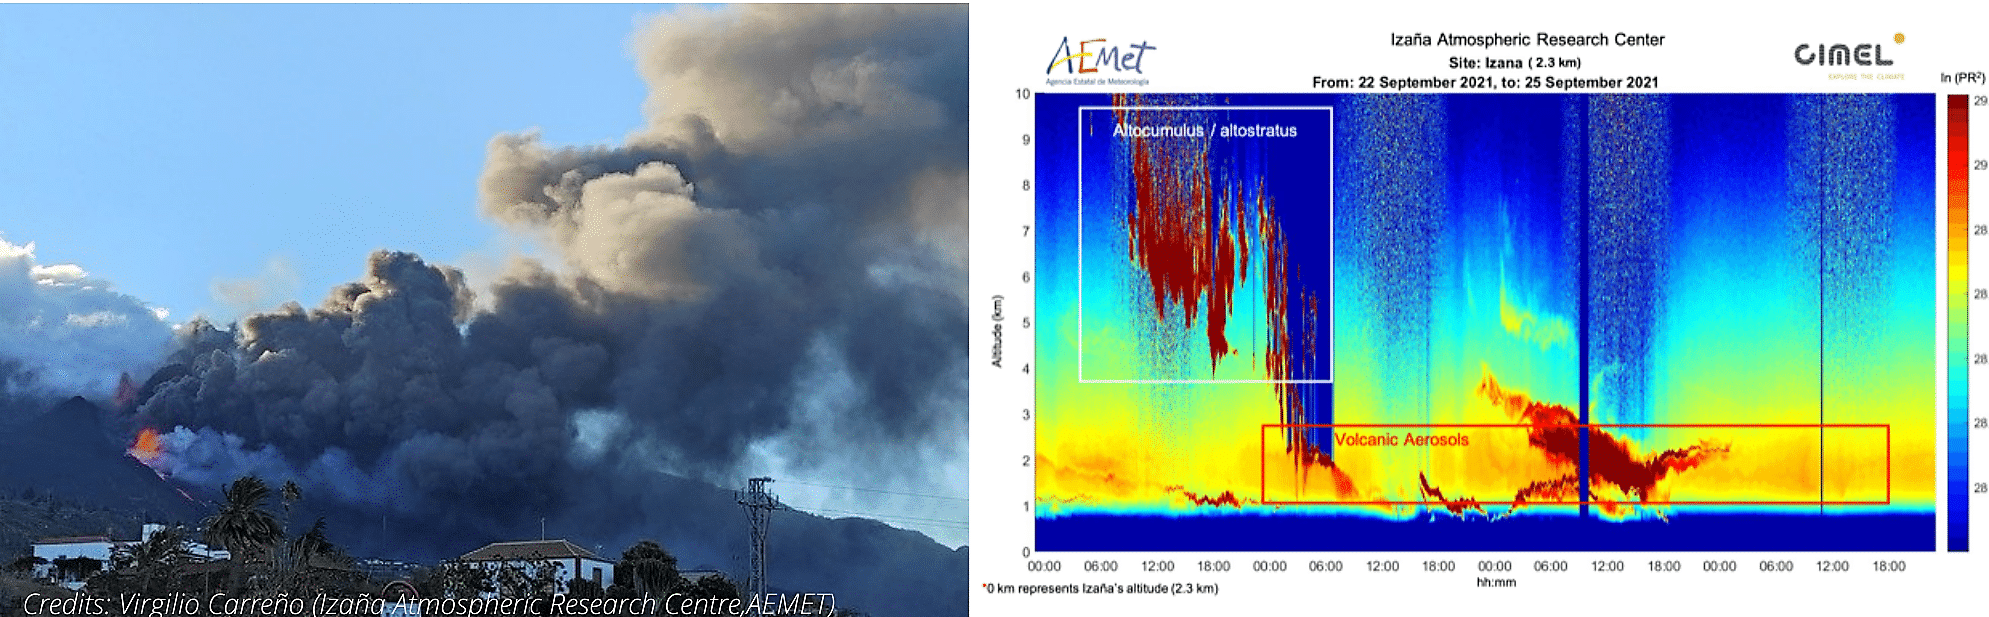
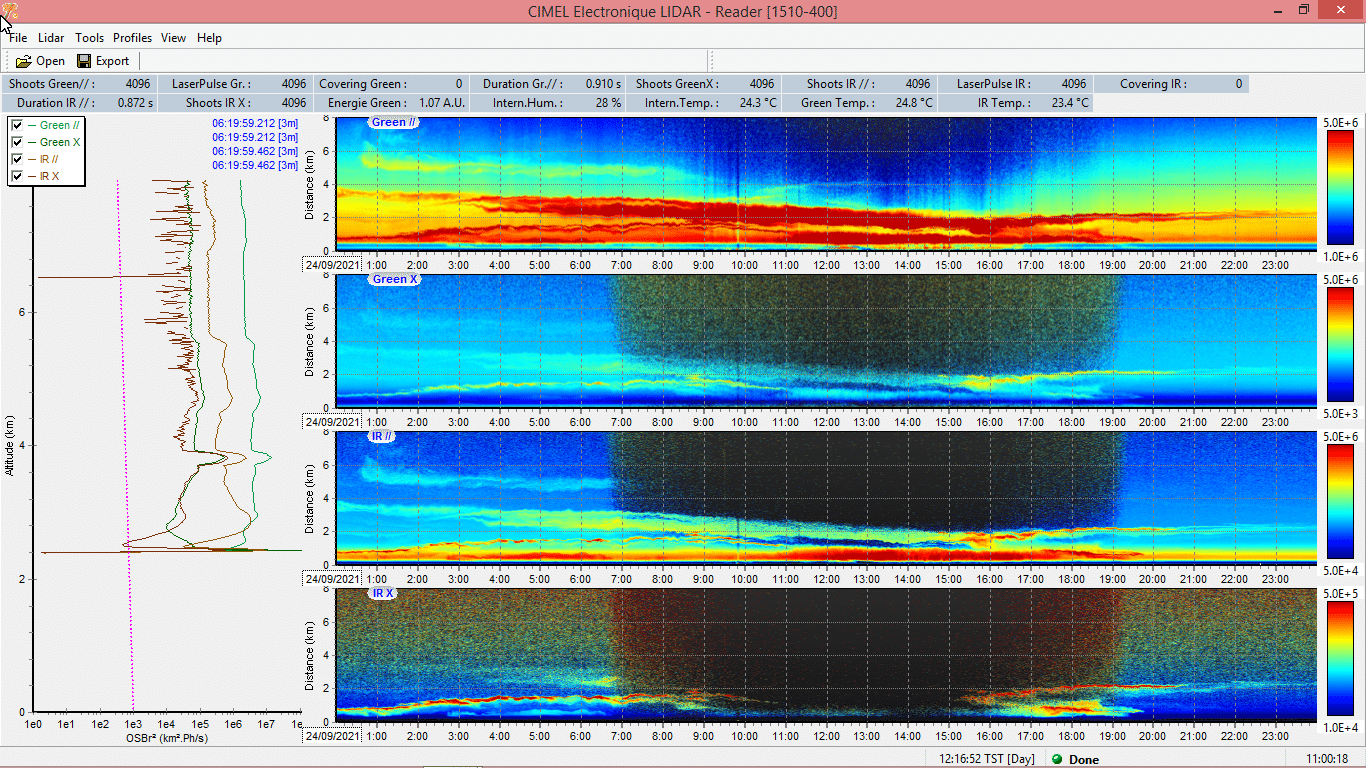
Our CE376 LiDARs in AEMET (Izaña) is tracking plumes of the volcanic ash from the volcanic eruption on La Palma and here are some results to illustrate it.
Figure 1: Quicklook revealing the volcano plumes as captured on 24 September by AEMET in Izaña.
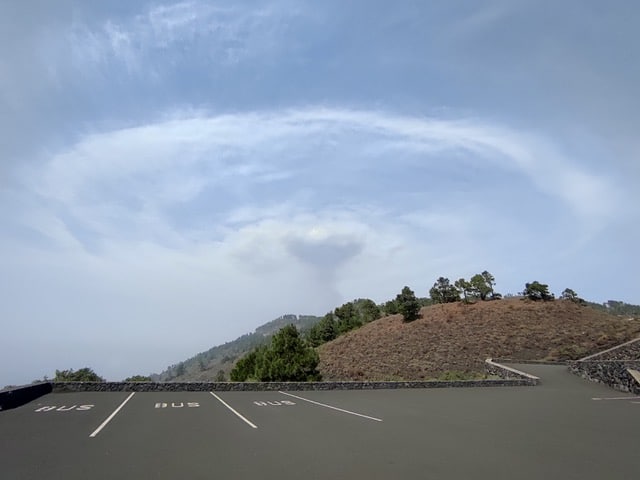
The volcano is propelling air into the atmosphere which meets a thermal inversion – a reversal of the normal behavior of temperature in the troposphere where a layer of hot air sits above a layer of cooler air.
Figure 2: Picture by Virgilio Carreño (Izaña Atmospheric research center, AEMET) showing the interaction of the gas and ash plume of the eruptive column leaving the volcano with the altitude thermal inversion layer of the atmosphere through which the Sahara desert dust transcends.
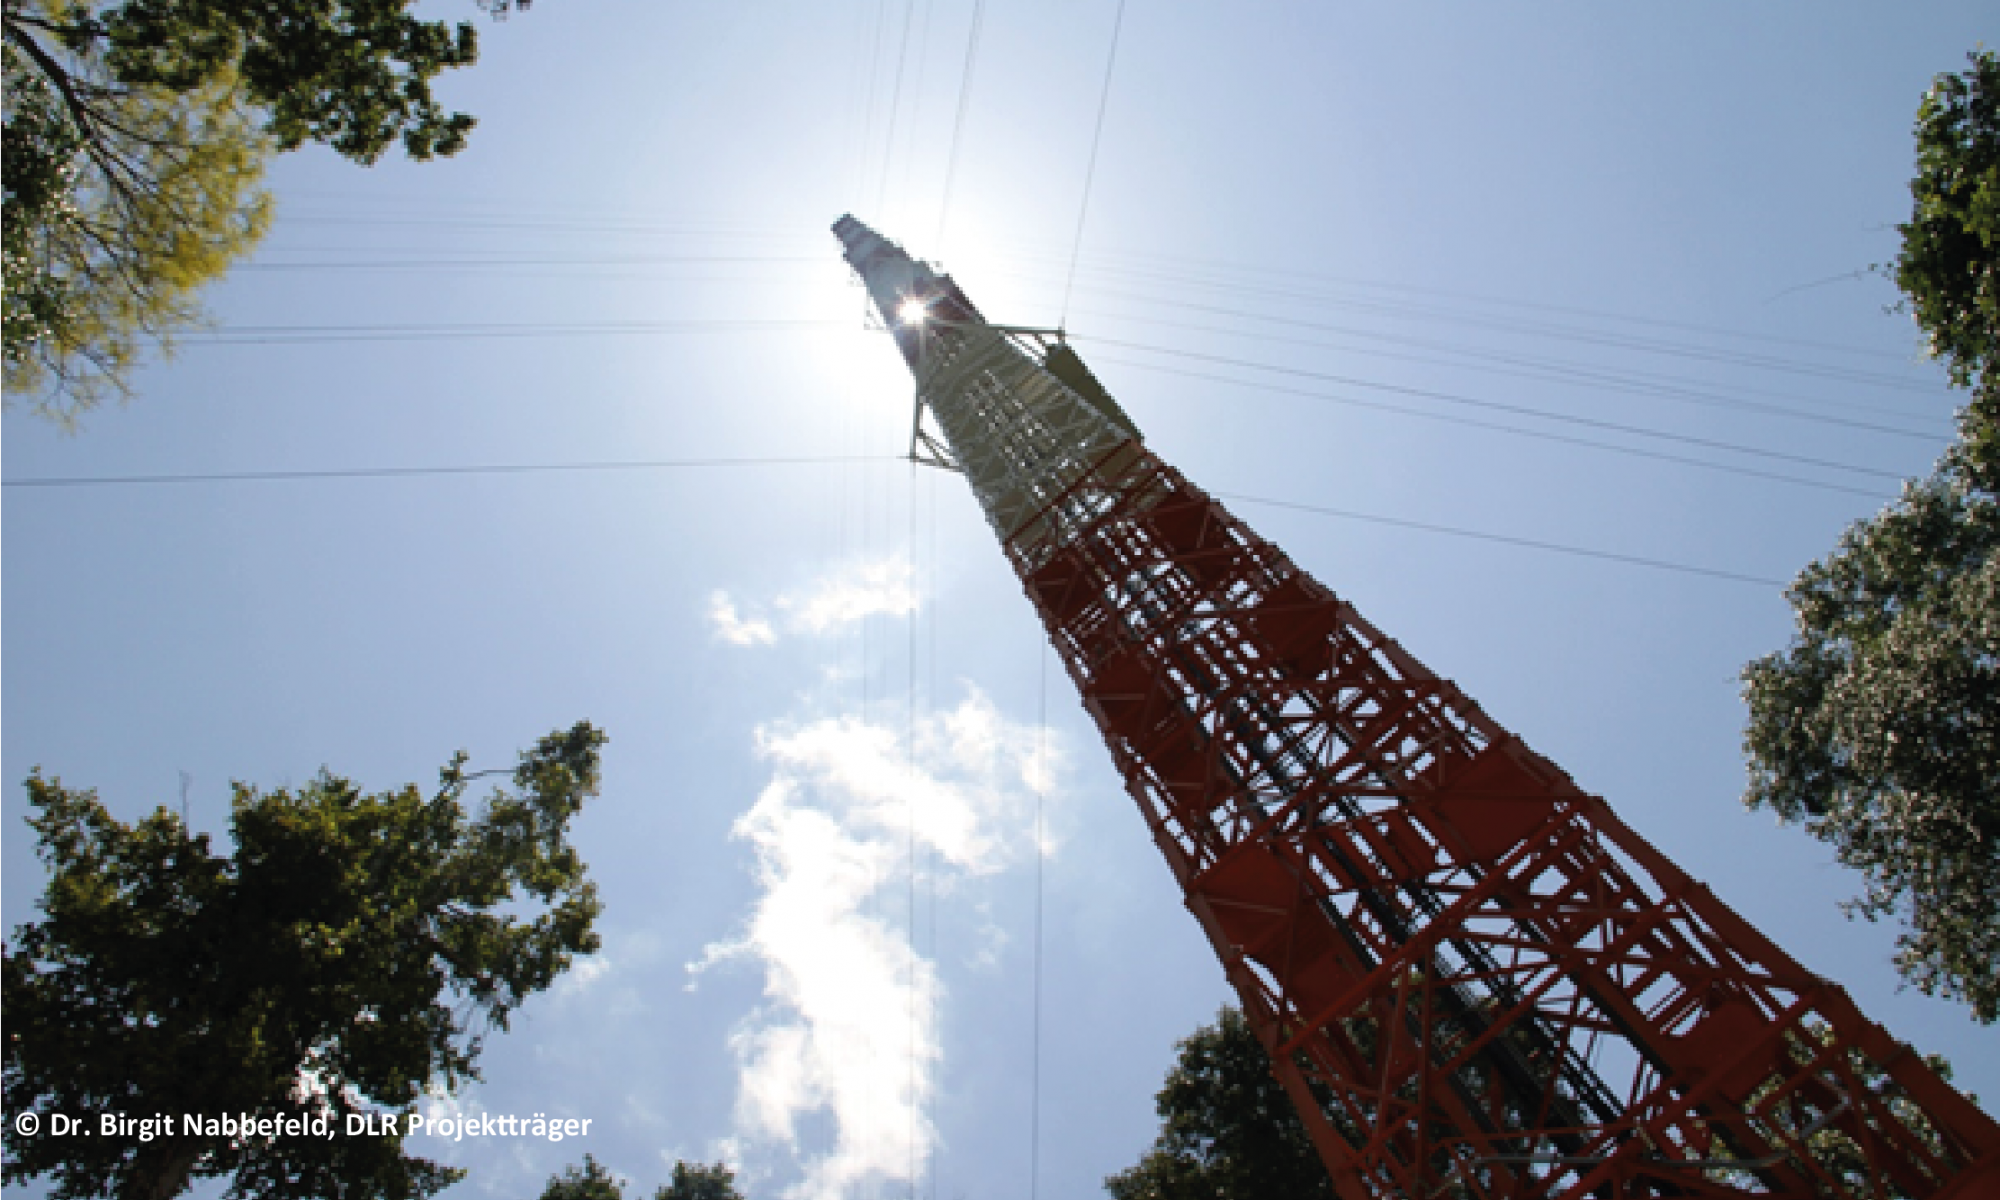
ATTO: the Amazon Tall Tower Observatory, an Amazon research project
Keywords : ATTO, Aerosols, Photometer, Atmosphere
The Amazon Tall Tower
Observatory (ATTO) is the world’s highest research facility located in the
middle of the Amazon rainforest in northern Brazil. It is a research site with a
325 meters tower for atmospheric observations.
This joint German-Brazilian
project was launched in 2008 in order to further the understanding of the
Amazon rainforest and its interaction with the soil beneath and the atmosphere
above. This is made possible by recording continuously meteorological, chemical
and biological data such as greenhouse gases or aerosols.
Scientists and researchers on
site hope to gain insights into how the Amazon interacts with the atmosphere
and the soil. This region is very important for the global climate as Saharan
dust, biomass smoke from Africa, urban and marine aerosols come from long
distances due to the winds. It is vital to get a better understanding of this
area for environmental decisions.
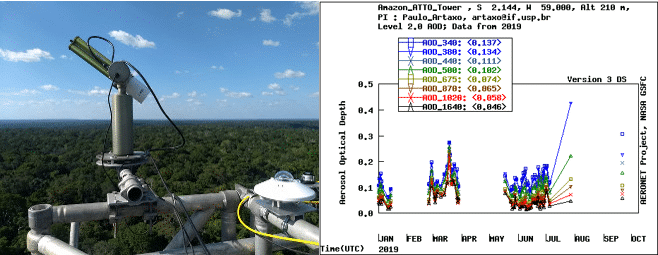
On this gigantic tower, a CE318-T photometer is installed at 210 meters from the ground and allows a more efficient calculation of the quantity of aerosols present in the air around this site. The photometer uses NASA’s AERONET calibration system to collect the most reliable data possible.
At the core of the project is
to learn more about biogeochemical cycles, the water cycle and energy fluxes in
the Amazon. The goal is to determine their impact on global climate and how
they are influenced by the changing climate and land-use change.
ATTO teams strive to close a
gap in the global climate monitoring network and want to improve climate
prediction models and to recognize the importance of the Amazon within the
climate system.
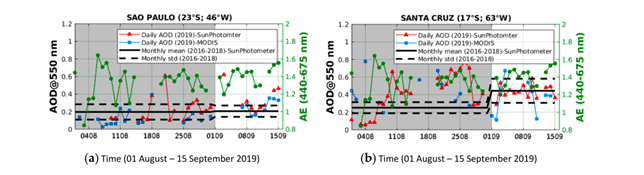
Thanks to our sun-photometer, the scientists on site were able to collect information on daily mean AOD values at 550 nm wavelength. These data allowed us to analyze the soils present in the atmosphere of the Amazon forest. Here some results of the ATTO project with our sun-photometer between August and September 2019.
Citation: Hassan
Bencherif, Nelson Bègue, Damaris Kirsch Pinheiro, David Du Preez, Jean-Maurice
Cadet, et al.. Investigating the Long-Range
Transport of Aerosol Plumes Following the Amazon Fires (August 2019): A
Multi-Instrumental Approach from Ground-Based and Satellite Observations.
Remote Sensing, MDPI, 2020, Advances in Remote Sensing of Biomass Burning, 12
(22), pp.3846.