First CIMEL CE-376 LiDAR Installed in Italy at ECO-CNR
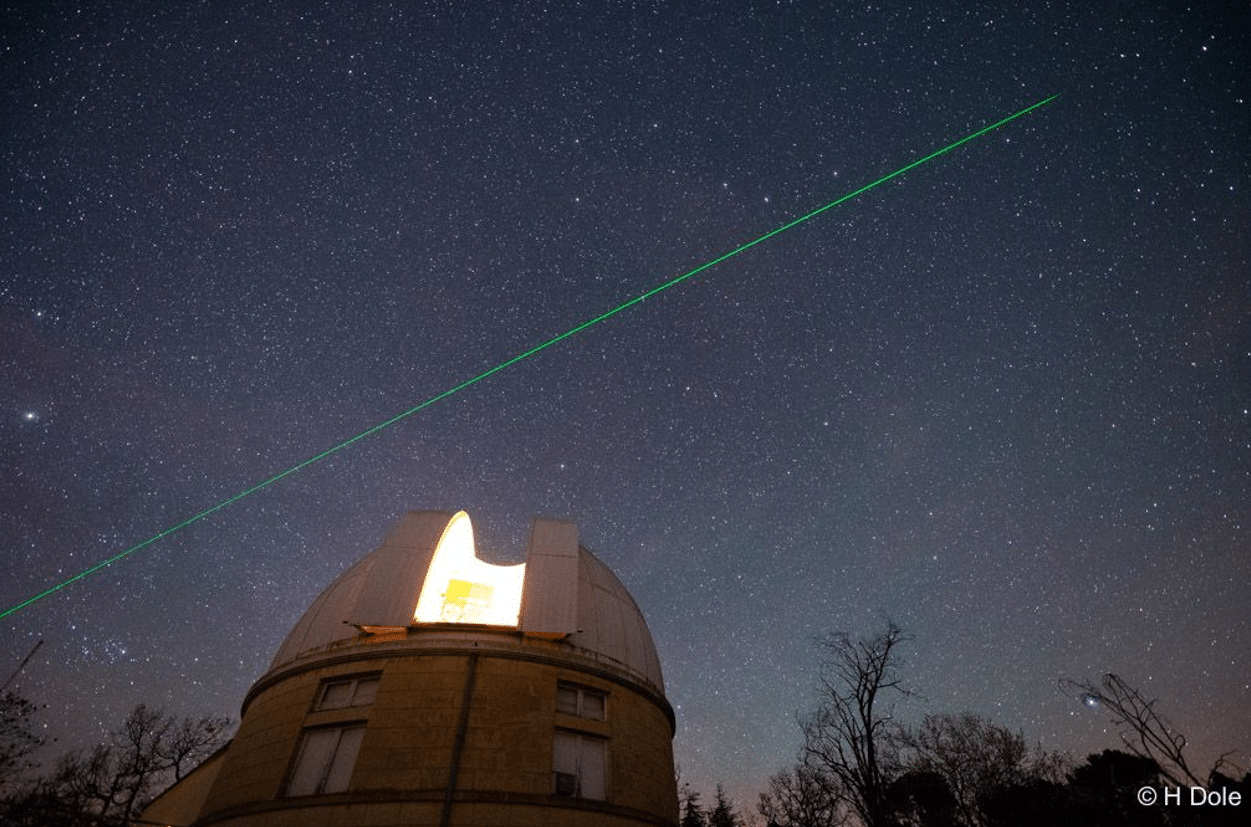
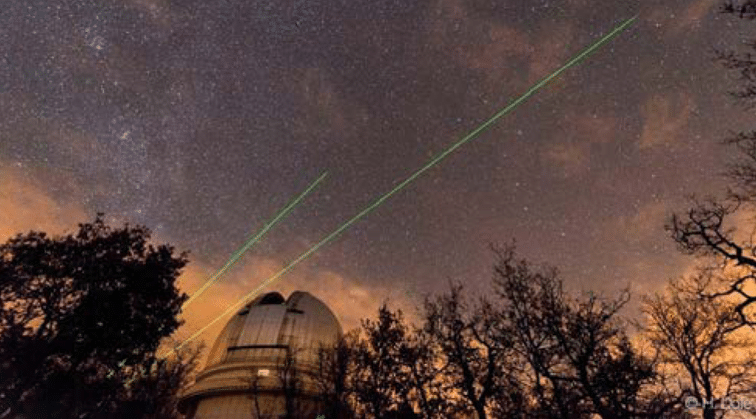
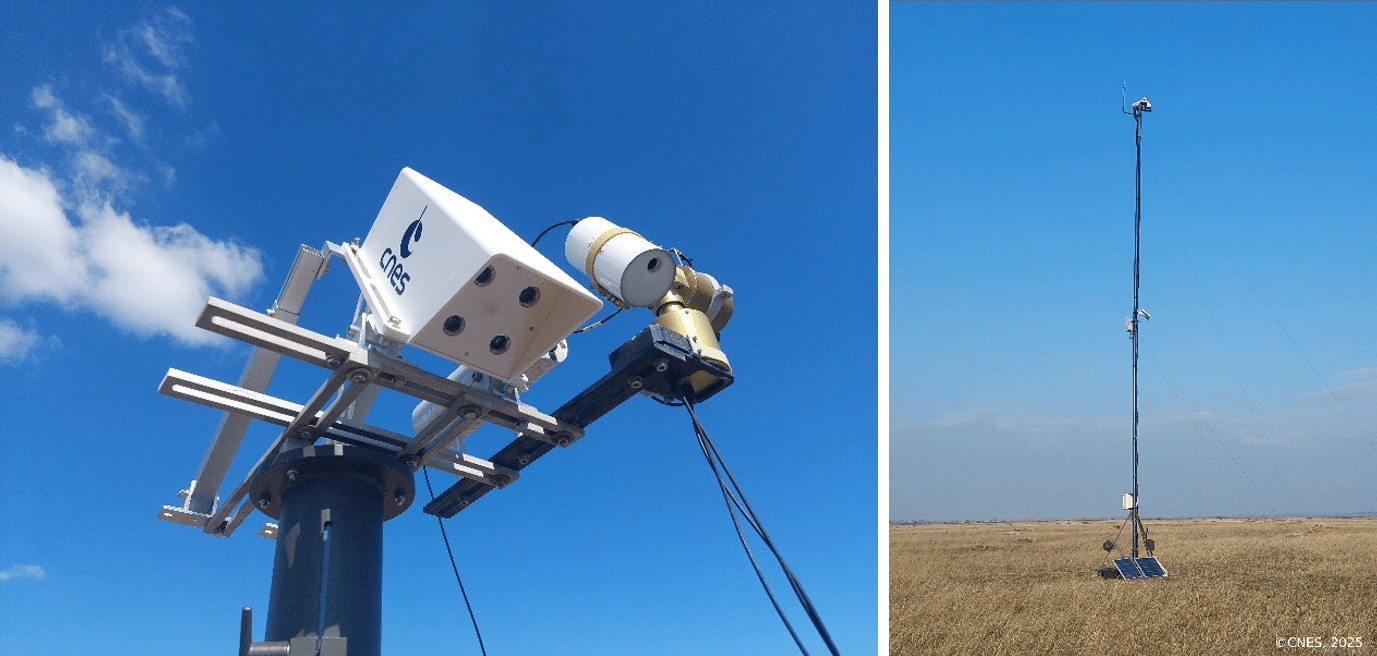
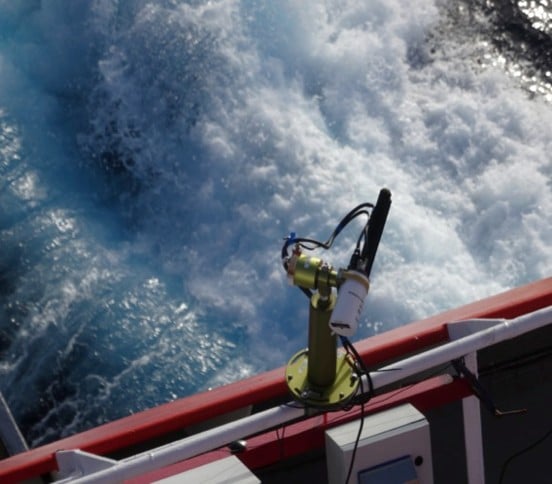
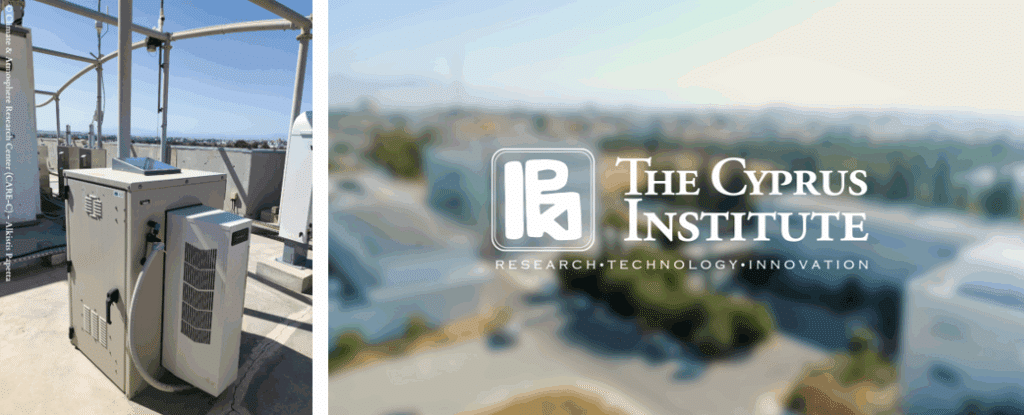
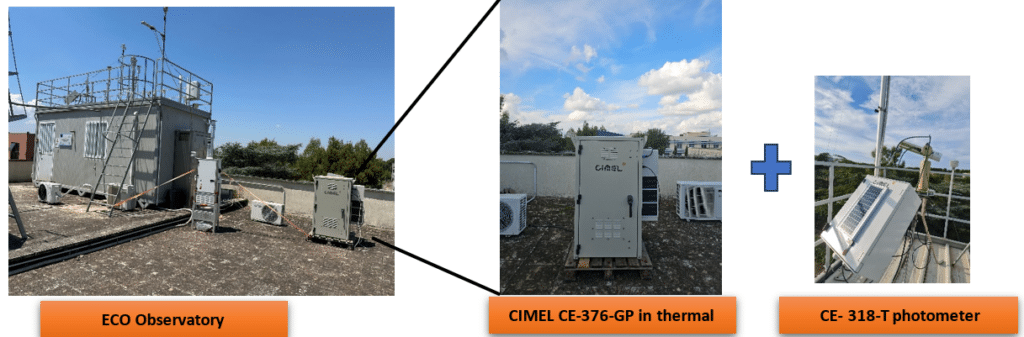
A new CIMEL CE376 LiDAR is now operating at the ECO-CNR Environmental-Climate Observatory in Lecce, marking the first installation of this system in Italy (Fig.1). The instrument brings a major upgrade to atmospheric air pollution monitoring by adding a capability often missing from routine observations: continuous information on the vertical distribution of aerosols.
With the CE376, aerosol backscatter profiles can be measured continuously in the lower and middle troposphere. This makes it possible to observe how pollution is distributed with height, how layers evolve over time, and how atmospheric dynamics control accumulation and dispersion. Rather than relying solely on surface concentrations, the system provides a structural view of air pollution, capturing its full vertical dimension.
One key application is the monitoring of the planetary boundary layer. Variations in the LiDAR signal allow the daily growth and collapse of the boundary layer to be tracked with high temporal resolution. Because most anthropogenic emissions are released near the surface, boundary layer height plays a central role in pollutant dilution and in the occurrence of sudden concentration peaks. LiDAR-derived boundary layer dynamics therefore offer a physically consistent explanation for day-to-day air quality variability.
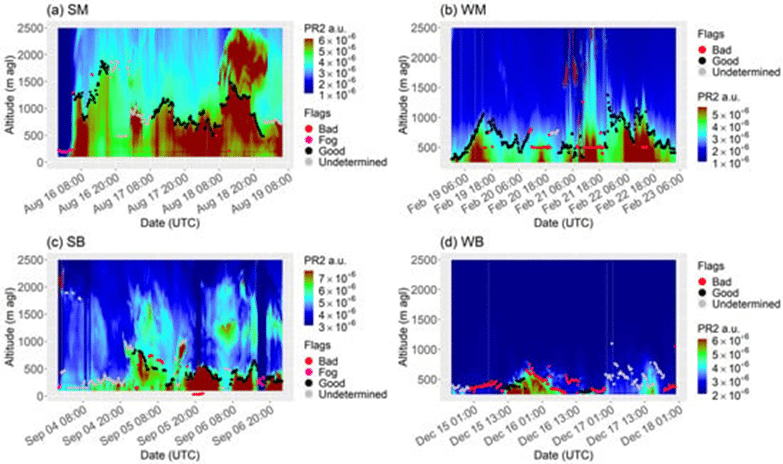
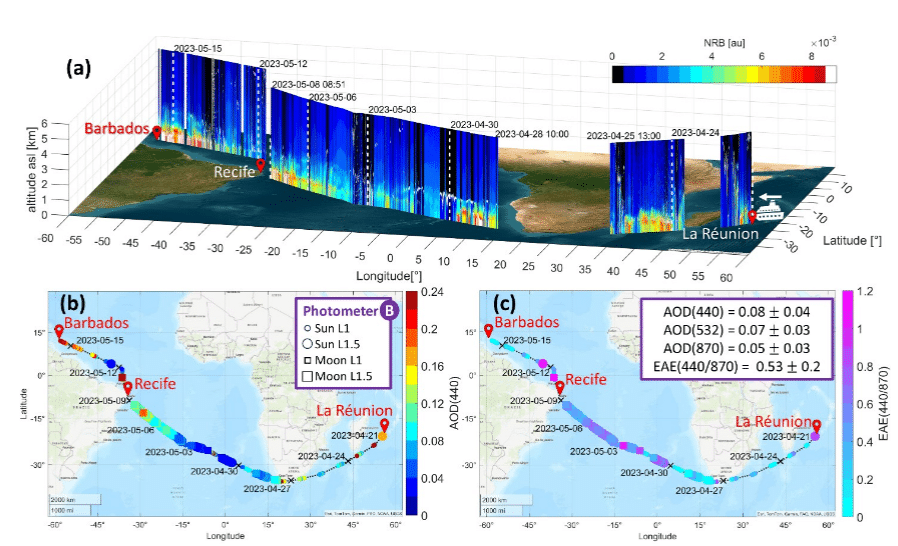
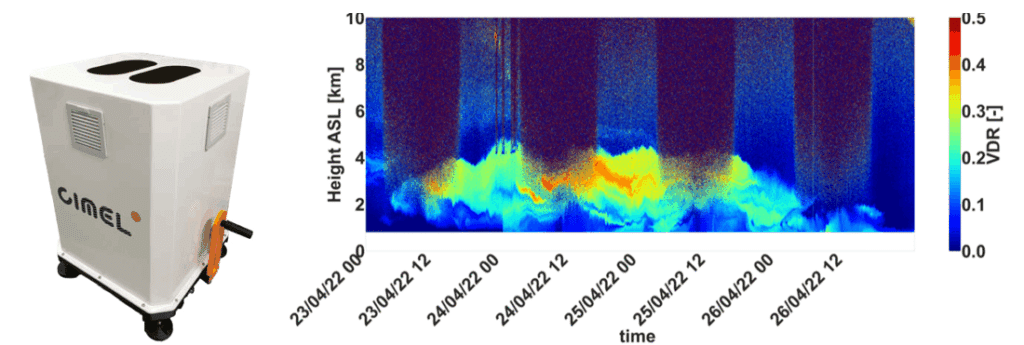
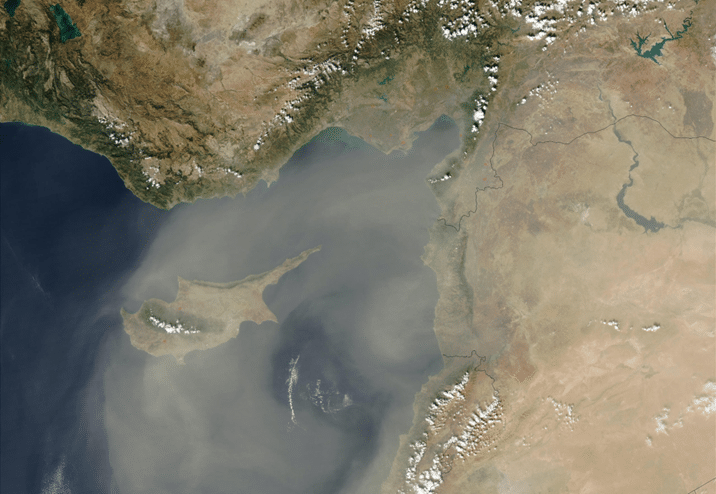
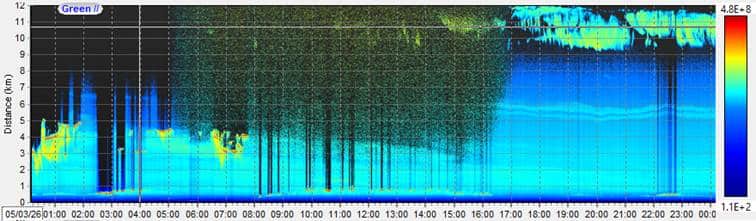
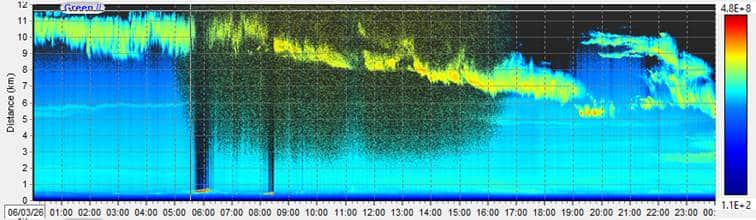
The CE376 is also particularly effective at detecting elevated aerosol layers that are decoupled from surface air quality. Long-range transported Saharan dust, wildfire smoke, or advected continental pollution often appear aloft, sometimes with little immediate impact at ground level. By resolving their altitude, thickness, and persistence, LiDAR observations help distinguish local pollution from transported aerosol events and prevent misinterpretation of column-integrated measurements. An example of a Saharan dust intrusion observed at the ECO site on 5-6 March 2026, is shown in Figure 2, where elastic LiDAR profiles at 532 nm captured an enhanced aerosol backscatter layer (yellow), revealing the presence of an elevated dust plume transported above the site.
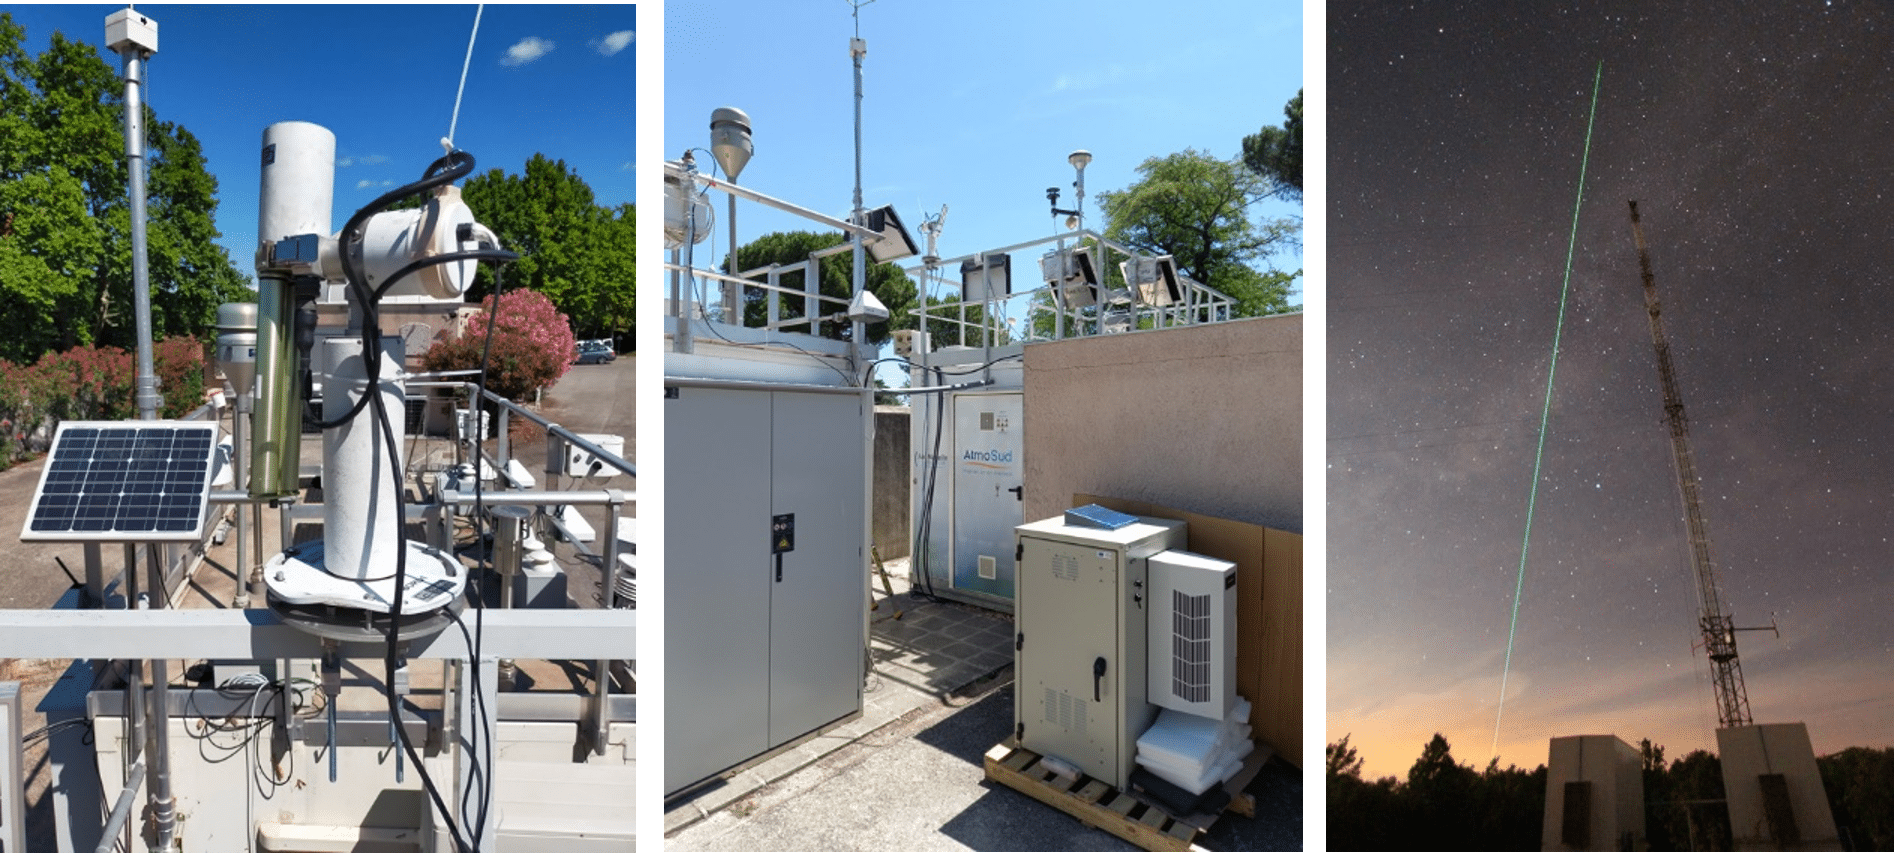
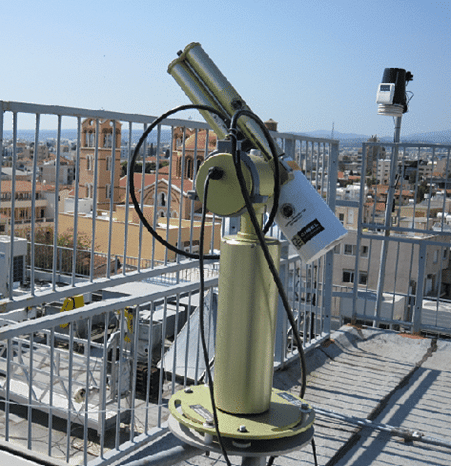
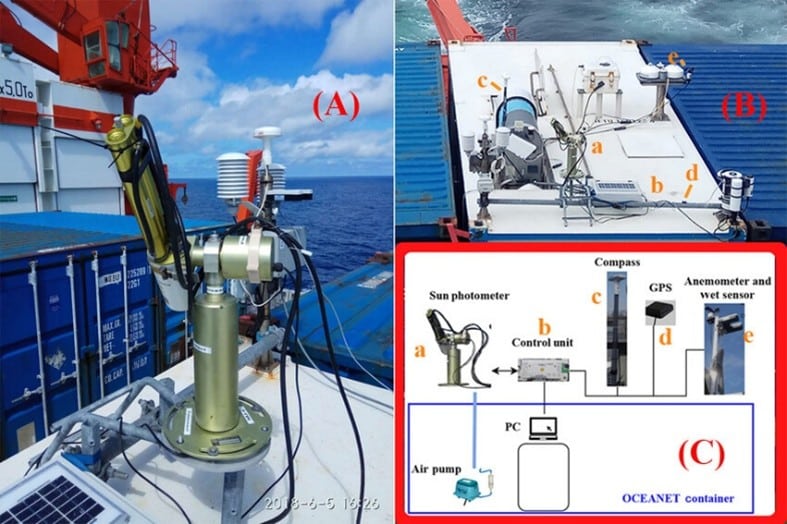
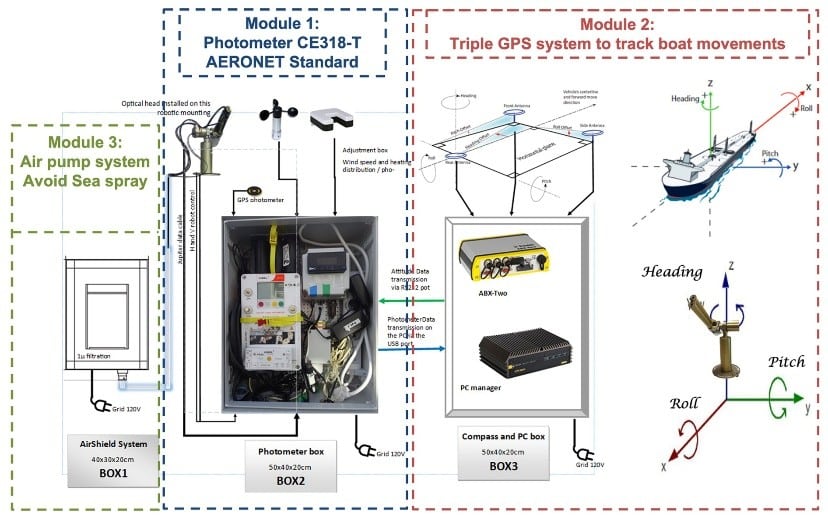
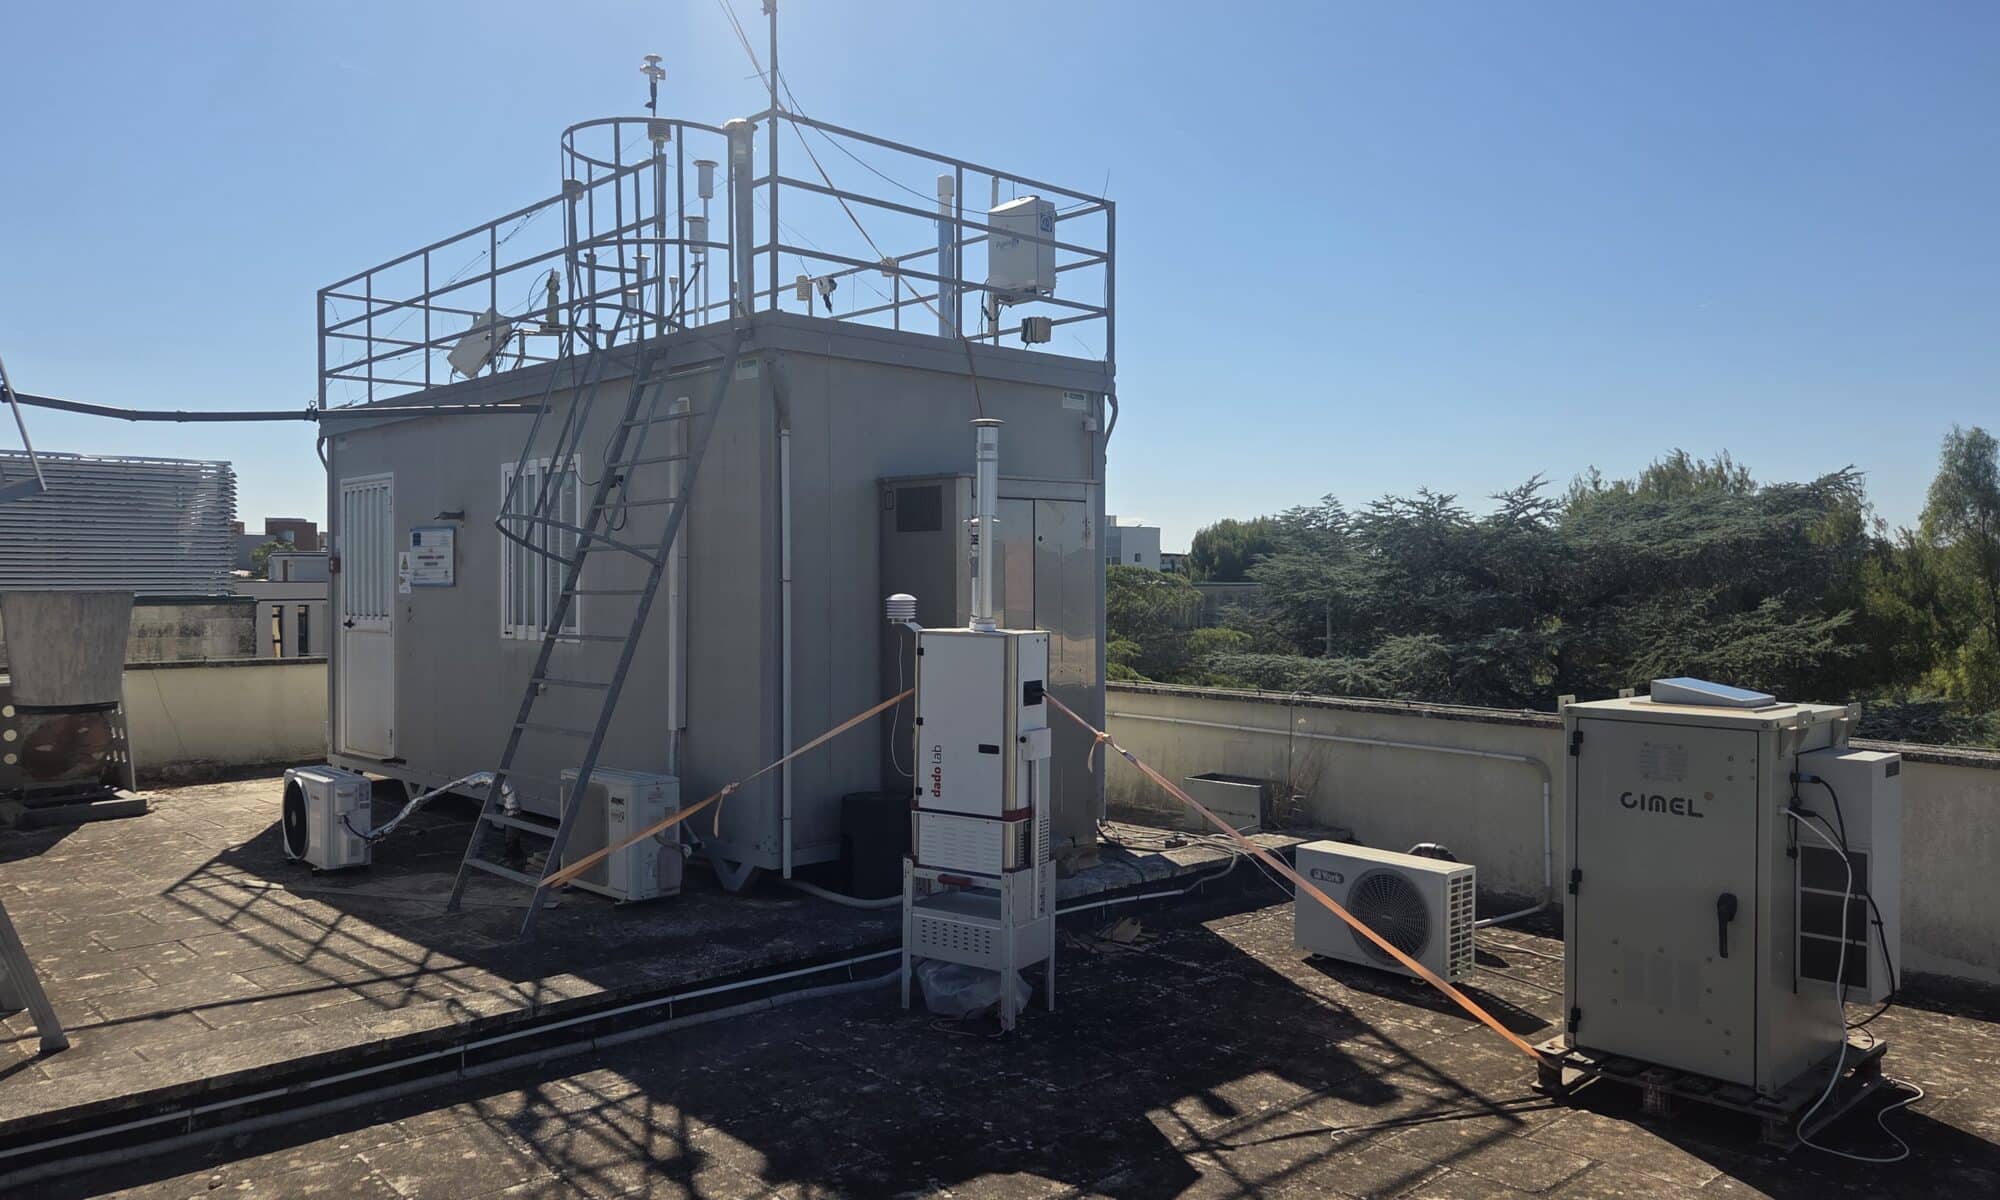
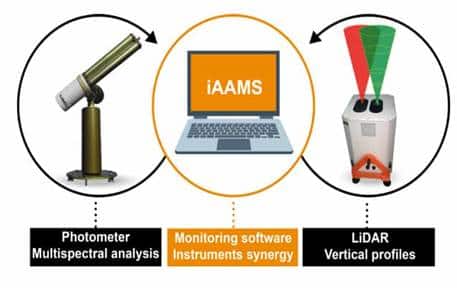
At ECO-CNR, the LiDAR operates alongside a CIMEL CE318-T sun–sky–lunar photometer, forming the iAAMS (Integrated Automatic Aerosol Monitoring Solutions) platform illustrated in Figure 3. This complementary observing system enables continuous aerosol monitoring during both daytime and nighttime by combining vertically resolved aerosol structure with high-quality columnar and spectral properties. This integrated approach strengthens aerosol source attribution and supports long-term atmospheric analyses, and is particularly valuable in the Mediterranean region, where episodic transport events strongly influence air quality conditions.
Beyond air pollution monitoring, this integrated observing system contributes to the evaluation of chemical transport models and to the validation of satellite products, including aerosol optical depth and vertically resolved aerosol layers. The CE376 installation at Lecce is part of the ITINERIS and PER-ACTRIS-IT projects, reinforcing the role of ground-based remote sensing within Italian and European atmospheric research infrastructures.
This first deployment of the CE376 LiDAR in Italy establishes a long-term aerosol profiling observatory, providing the vertical context needed for a more comprehensive understanding of atmospheric aerosol dynamics, from local pollution processes to regional and long-range transport.